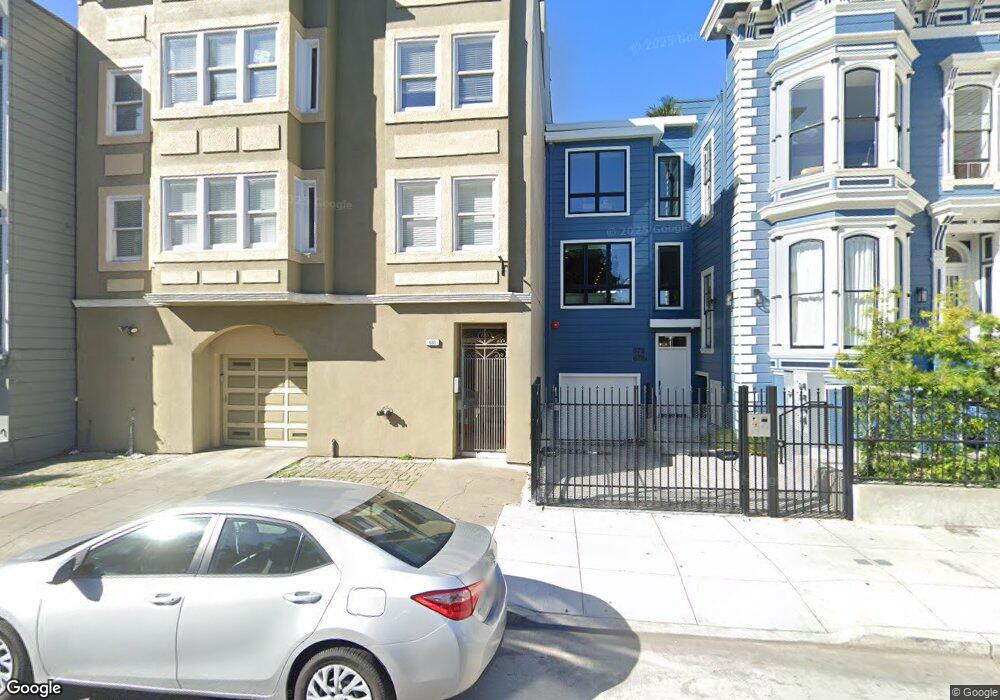
680 Capp St Unit 202 San Francisco, CA 94110
Inner Mission NeighborhoodEstimated Value: $660,554 - $1,050,000
2
Beds
1
Bath
773
Sq Ft
$1,117/Sq Ft
Est. Value
About This Home
This home is located at 680 Capp St Unit 202, San Francisco, CA 94110 and is currently estimated at $863,389, approximately $1,116 per square foot. 680 Capp St Unit 202 is a home located in San Francisco County with nearby schools including George Moscone Elementary, Hoover (Herbert) Middle School, and Thomas Edison Charter Academy.
Ownership History
Date
Name
Owned For
Owner Type
Purchase Details
Closed on
Feb 15, 2024
Sold by
Raskin Trust
Bought by
Raskin Richard B
Current Estimated Value
Purchase Details
Closed on
Apr 22, 2015
Sold by
Raskin Richard
Bought by
Raskin Richard B
Create a Home Valuation Report for This Property
The Home Valuation Report is an in-depth analysis detailing your home's value as well as a comparison with similar homes in the area
Home Values in the Area
Average Home Value in this Area
Purchase History
| Date | Buyer | Sale Price | Title Company |
|---|---|---|---|
| Raskin Richard B | -- | None Listed On Document | |
| Raskin Richard B | -- | None Available |
Source: Public Records
Tax History Compared to Growth
Tax History
| Year | Tax Paid | Tax Assessment Tax Assessment Total Assessment is a certain percentage of the fair market value that is determined by local assessors to be the total taxable value of land and additions on the property. | Land | Improvement |
|---|---|---|---|---|
| 2025 | $2,950 | $179,176 | $72,200 | $106,976 |
| 2024 | $2,950 | $175,664 | $70,785 | $104,879 |
| 2023 | $2,869 | $172,184 | $69,382 | $102,802 |
| 2022 | $2,789 | $168,810 | $68,022 | $100,788 |
| 2021 | $2,736 | $165,502 | $66,690 | $98,812 |
| 2020 | $2,819 | $163,808 | $66,008 | $97,800 |
| 2019 | $2,681 | $160,598 | $64,714 | $95,884 |
| 2018 | $2,595 | $157,450 | $63,446 | $94,004 |
| 2017 | $2,267 | $154,364 | $62,202 | $92,162 |
| 2016 | $2,202 | $151,340 | $60,984 | $90,356 |
| 2015 | $2,173 | $149,068 | $60,068 | $89,000 |
| 2014 | -- | $146,150 | $58,892 | $87,258 |
Source: Public Records
Map
Nearby Homes
- 45 Bartlett St Unit 617
- 45 Bartlett St Unit 416
- 45 Bartlett St Unit 609
- 45 Bartlett St Unit 417
- 45 Bartlett St Unit 515
- 937 S South van Ness Ave
- 986 S Van Ness Ave Unit 203
- 569 Capp St Unit 571
- 503 Capp St
- 3545 20th St
- 3470 20th St Unit 2
- 2579 Folsom St
- 3116-3118 23rd St
- 0 Alvarado St
- 3346 21st St Unit 3346
- 828-830 Treat Ave
- 49 Liberty St Unit 2
- 2946 22nd St
- 3340-3342 24th St
- 2360 Folsom St Unit A
- 680 Capp St Unit 301
- 680 Capp St Unit 201
- 680 Capp St Unit 102
- 680 Capp St Unit 101
- 676 Capp St
- 686 Capp St
- 678 Capp St Unit A
- 674 Capp St
- 688 Capp St Unit 688
- 672A Capp St
- 668 Capp St
- 3164 22nd St Unit 21
- 3164 22nd St Unit 15
- 3164 22nd St Unit 12
- 662 Capp St Unit 4
- 662 Capp St Unit 3
- 662 Capp St Unit IT3
- 662 Capp St Unit IT2
- 662 Capp St Unit IT1
- 662 Capp St Unit IT4