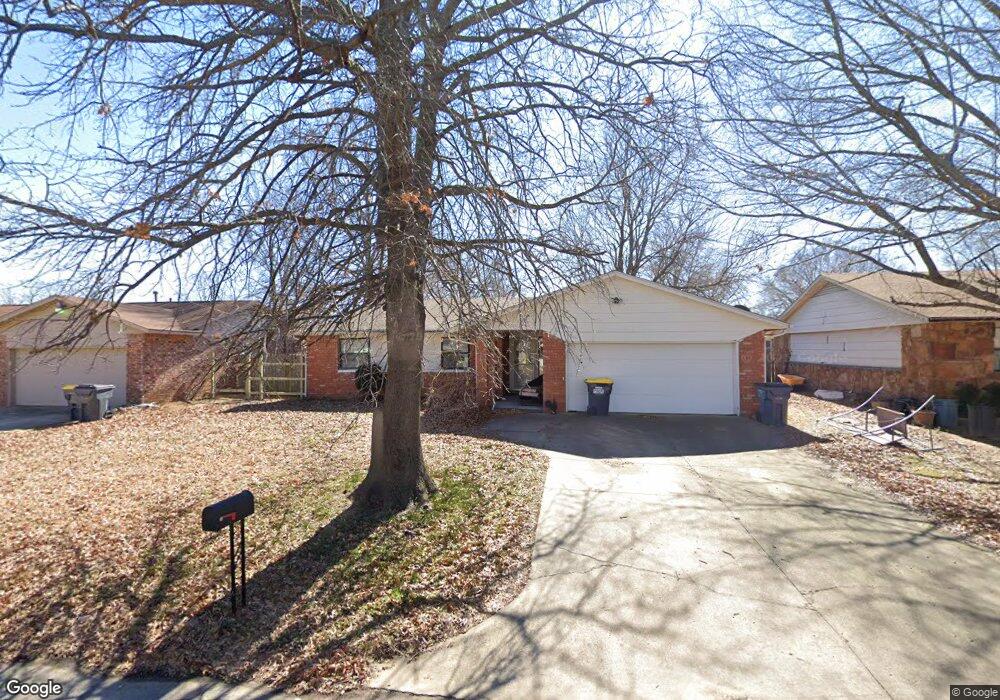
680 E 135th St Glenpool, OK 74033
Estimated Value: $174,000 - $194,000
3
Beds
2
Baths
1,214
Sq Ft
$153/Sq Ft
Est. Value
About This Home
This home is located at 680 E 135th St, Glenpool, OK 74033 and is currently estimated at $185,383, approximately $152 per square foot. 680 E 135th St is a home located in Tulsa County with nearby schools including Glenpool Elementary School, Glenpool Middle School, and Glenpool High School.
Ownership History
Date
Name
Owned For
Owner Type
Purchase Details
Closed on
Apr 8, 2015
Sold by
Copeland Travis and Copeland Cyrstal
Bought by
Infinity Investments Group Llc
Current Estimated Value
Home Financials for this Owner
Home Financials are based on the most recent Mortgage that was taken out on this home.
Original Mortgage
$800,000
Interest Rate
3.89%
Mortgage Type
Commercial
Purchase Details
Closed on
Nov 21, 2003
Sold by
Sullivan Jordan D and Sullivan Wendy A
Bought by
Copeland Crystal
Purchase Details
Closed on
Nov 26, 2001
Sold by
Sullivan Jordan D and Sullivan Wendy A
Bought by
Sullivan Jordan D and Sullivan Wendy A
Purchase Details
Closed on
Jul 30, 1999
Sold by
Bridgewater Daniel A and Bridgewater Keli D
Bought by
Sullivan Jordan D
Purchase Details
Closed on
Jan 1, 1994
Create a Home Valuation Report for This Property
The Home Valuation Report is an in-depth analysis detailing your home's value as well as a comparison with similar homes in the area
Home Values in the Area
Average Home Value in this Area
Purchase History
| Date | Buyer | Sale Price | Title Company |
|---|---|---|---|
| Infinity Investments Group Llc | $85,000 | First American Title & Abstr | |
| Copeland Crystal | $78,000 | Multiple | |
| Sullivan Jordan D | -- | Delta Title & Escrow | |
| Sullivan Jordan D | $65,000 | -- | |
| -- | $51,500 | -- |
Source: Public Records
Mortgage History
| Date | Status | Borrower | Loan Amount |
|---|---|---|---|
| Closed | Infinity Investments Group Llc | $800,000 |
Source: Public Records
Tax History
| Year | Tax Paid | Tax Assessment Tax Assessment Total Assessment is a certain percentage of the fair market value that is determined by local assessors to be the total taxable value of land and additions on the property. | Land | Improvement |
|---|---|---|---|---|
| 2025 | $1,656 | $13,815 | $1,820 | $11,995 |
| 2024 | $1,467 | $13,156 | $1,860 | $11,296 |
| 2023 | $1,467 | $12,530 | $1,947 | $10,583 |
| 2022 | $1,375 | $11,933 | $2,398 | $9,535 |
| 2021 | $1,330 | $11,365 | $2,284 | $9,081 |
| 2020 | $1,276 | $10,824 | $2,175 | $8,649 |
| 2019 | $1,224 | $10,309 | $2,072 | $8,237 |
| 2018 | $1,160 | $9,817 | $1,973 | $7,844 |
| 2017 | $1,081 | $9,350 | $1,879 | $7,471 |
| 2016 | $1,092 | $9,350 | $1,879 | $7,581 |
| 2015 | $961 | $9,538 | $1,879 | $7,659 |
| 2014 | $934 | $8,999 | $1,773 | $7,226 |
Source: Public Records
Map
Nearby Homes
- 13653 S Hickory Place
- 661 E 133rd Place
- 582 E 133rd Place
- 13674 S Maple St
- 1024 E 135th Place
- 13826 S Elm St
- 1104 E 137th St
- 265 E Glenpool Blvd
- 1211 E 135th St
- 13796 S Nyssa Place
- 1171 E 133rd St
- 13761 S Nyssa Ct
- 13324 S Poplar St
- 243 E 141st St
- 13773 S Oak Place
- 687 E 142nd Place
- 1671 E 140th St
- 2355 E 135th Place
- 1664 E 138th St S
- 13659 S Quincy St
- 688 E 135th St
- 672 E 135th St
- 692 E 135th St
- 681 E 135th Place
- 673 E 135th Place
- 693 E 135th Place
- 660 E 135th St
- 696 E 135th St
- 681 E 135th St
- 661 E 135th Place
- 673 E 135th St
- 693 E 135th St
- 652 E 135th St
- 661 E 135th St
- 13508 S Hickory Place
- 653 E 135th Place
- 653 E 135th St
- 640 E 135th St
- 688 E 135th Place
- 678 E 135th Place
Your Personal Tour Guide
Ask me questions while you tour the home.