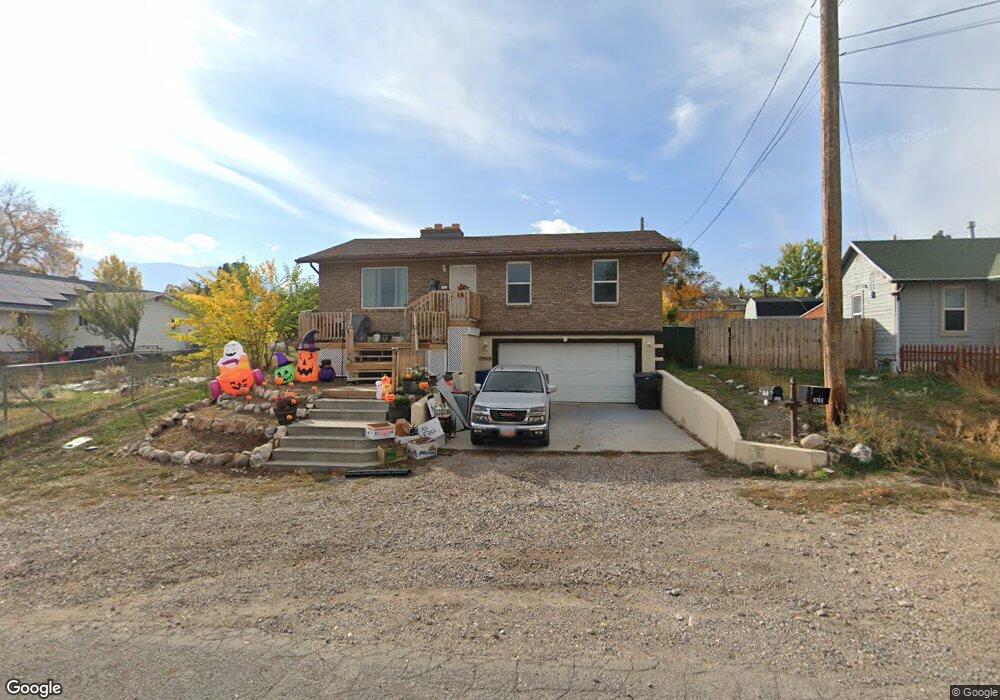
680 E 200 S Payson, UT 84651
Estimated Value: $496,000 - $554,000
5
Beds
3
Baths
3,320
Sq Ft
$156/Sq Ft
Est. Value
About This Home
This home is located at 680 E 200 S, Payson, UT 84651 and is currently estimated at $517,513, approximately $155 per square foot. 680 E 200 S is a home located in Utah County with nearby schools including Barnett Elementary School, Salem Junior High School, and Valley View Middle School.
Ownership History
Date
Name
Owned For
Owner Type
Purchase Details
Closed on
May 4, 2023
Sold by
Baird Jonathan R
Bought by
James David and James Stacy
Current Estimated Value
Home Financials for this Owner
Home Financials are based on the most recent Mortgage that was taken out on this home.
Original Mortgage
$439,900
Outstanding Balance
$393,481
Interest Rate
5.68%
Mortgage Type
Balloon
Estimated Equity
$124,032
Purchase Details
Closed on
Jun 9, 2016
Sold by
Holman Glen S and Holman Lori J
Bought by
Baird Jonathan R and Baird Lois E
Purchase Details
Closed on
Aug 10, 2006
Sold by
Draper Darian M
Bought by
Draper Dale K
Purchase Details
Closed on
May 27, 2005
Sold by
Draper Dale K
Bought by
Holman Glen S and Holman Lori J
Home Financials for this Owner
Home Financials are based on the most recent Mortgage that was taken out on this home.
Original Mortgage
$8,200
Interest Rate
5.72%
Mortgage Type
Unknown
Create a Home Valuation Report for This Property
The Home Valuation Report is an in-depth analysis detailing your home's value as well as a comparison with similar homes in the area
Home Values in the Area
Average Home Value in this Area
Purchase History
| Date | Buyer | Sale Price | Title Company |
|---|---|---|---|
| James David | -- | Gt Title Services | |
| Baird Jonathan R | -- | None Available | |
| Draper Dale K | -- | None Available | |
| Holman Glen S | -- | Title West Title Company |
Source: Public Records
Mortgage History
| Date | Status | Borrower | Loan Amount |
|---|---|---|---|
| Open | James David | $439,900 | |
| Previous Owner | Holman Glen S | $8,200 | |
| Previous Owner | Holman Glen S | $147,600 |
Source: Public Records
Tax History
| Year | Tax Paid | Tax Assessment Tax Assessment Total Assessment is a certain percentage of the fair market value that is determined by local assessors to be the total taxable value of land and additions on the property. | Land | Improvement |
|---|---|---|---|---|
| 2025 | $2,560 | $263,945 | -- | -- |
| 2024 | $2,560 | $260,535 | $0 | $0 |
| 2023 | $2,614 | $266,750 | $0 | $0 |
| 2022 | $2,491 | $250,030 | $0 | $0 |
| 2021 | $2,052 | $330,300 | $84,900 | $245,400 |
| 2020 | $1,963 | $309,100 | $77,200 | $231,900 |
| 2019 | $1,669 | $269,500 | $66,700 | $202,800 |
| 2018 | $1,631 | $253,900 | $56,100 | $197,800 |
| 2017 | $1,485 | $124,300 | $0 | $0 |
| 2016 | $1,314 | $109,230 | $0 | $0 |
| 2015 | $1,236 | $102,080 | $0 | $0 |
| 2014 | $1,218 | $101,310 | $0 | $0 |
Source: Public Records
Map
Nearby Homes
Your Personal Tour Guide
Ask me questions while you tour the home.