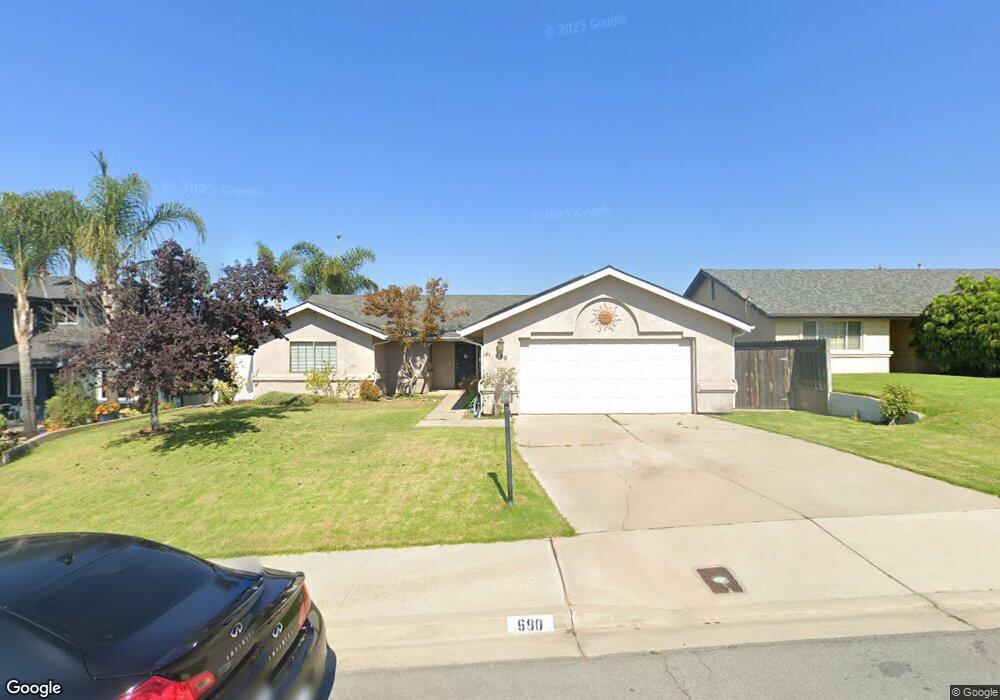
680 January St Nipomo, CA 93444
Estimated Value: $726,000 - $782,000
3
Beds
2
Baths
1,633
Sq Ft
$462/Sq Ft
Est. Value
About This Home
This home is located at 680 January St, Nipomo, CA 93444 and is currently estimated at $753,929, approximately $461 per square foot. 680 January St is a home located in San Luis Obispo County with nearby schools including Dana Elementary School, Mesa Middle School, and Nipomo High School.
Ownership History
Date
Name
Owned For
Owner Type
Purchase Details
Closed on
Jan 19, 2007
Sold by
Solan Thom V
Bought by
Chew Timothy and Chew Jennifer
Current Estimated Value
Home Financials for this Owner
Home Financials are based on the most recent Mortgage that was taken out on this home.
Original Mortgage
$356,000
Outstanding Balance
$212,508
Interest Rate
6.19%
Mortgage Type
Purchase Money Mortgage
Estimated Equity
$541,421
Purchase Details
Closed on
Apr 9, 2003
Sold by
Campos Ricardo and Campos Estella A
Bought by
Solan Thom
Home Financials for this Owner
Home Financials are based on the most recent Mortgage that was taken out on this home.
Original Mortgage
$288,000
Interest Rate
5.71%
Mortgage Type
Purchase Money Mortgage
Purchase Details
Closed on
Feb 14, 1994
Sold by
Farroll Gardens
Bought by
Campos Ricardo and Campos Estella A
Home Financials for this Owner
Home Financials are based on the most recent Mortgage that was taken out on this home.
Original Mortgage
$156,750
Interest Rate
7.24%
Create a Home Valuation Report for This Property
The Home Valuation Report is an in-depth analysis detailing your home's value as well as a comparison with similar homes in the area
Home Values in the Area
Average Home Value in this Area
Purchase History
| Date | Buyer | Sale Price | Title Company |
|---|---|---|---|
| Chew Timothy | $445,000 | Chicago Title Co | |
| Solan Thom | $360,000 | Chicago Title Company | |
| Campos Ricardo | $165,000 | Cuesta Title Guaranty Compan |
Source: Public Records
Mortgage History
| Date | Status | Borrower | Loan Amount |
|---|---|---|---|
| Open | Chew Timothy | $356,000 | |
| Previous Owner | Solan Thom | $288,000 | |
| Previous Owner | Campos Ricardo | $156,750 |
Source: Public Records
Tax History Compared to Growth
Tax History
| Year | Tax Paid | Tax Assessment Tax Assessment Total Assessment is a certain percentage of the fair market value that is determined by local assessors to be the total taxable value of land and additions on the property. | Land | Improvement |
|---|---|---|---|---|
| 2025 | $6,077 | $596,191 | $334,938 | $261,253 |
| 2024 | $6,006 | $584,502 | $328,371 | $256,131 |
| 2023 | $6,006 | $573,042 | $321,933 | $251,109 |
| 2022 | $5,914 | $561,807 | $315,621 | $246,186 |
| 2021 | $5,902 | $550,792 | $309,433 | $241,359 |
| 2020 | $5,834 | $545,146 | $306,261 | $238,885 |
| 2019 | $5,595 | $516,000 | $290,000 | $226,000 |
| 2018 | $5,473 | $501,000 | $282,000 | $219,000 |
| 2017 | $4,826 | $442,000 | $250,000 | $192,000 |
| 2016 | $4,409 | $420,000 | $235,000 | $185,000 |
| 2015 | $4,093 | $390,000 | $220,000 | $170,000 |
| 2014 | $3,759 | $365,000 | $205,000 | $160,000 |
Source: Public Records
Map
Nearby Homes
- 626 Juno Ct
- 368 Avenida de Amigos
- 450 Avenida de Socios Unit 12
- 232 Scarlett Cir
- 483 Violet Ave
- 525 Grande Ave Unit D
- Mesa Plan at Hill Street Terraces - Hill Street Series
- Pacific Plan at Hill Street Terraces - Hill Street Series
- Monarch Plan at Hill Street Terraces - Hill Street Series
- Rancho Plan at Hill Street Terraces - Hill Street Series
- Dana Plan at Hill Street Terraces - Hill Street Series
- 522 Higos Way
- 725 Monarch Ln
- 680 Hill St
- 719 W Tefft St
- 449 W Tefft St Unit 23
- 449 W Tefft St Unit 13
- 840 Story St
- 424 Bermuda Place
- 160 San Antonio Ln
- 674 January St
- 686 January St
- 668 January St
- 692 January St
- 677 January St
- 683 January St
- 421 Alegre Ave
- 689 January St
- 696 January St
- 427 Alegre Ave
- 422 Blume St
- 678 Mesa Sands Way
- 684 Mesa Sands Way
- 656 January St
- 690 Mesa Sands Way
- 428 Blume St
- 435 Alegre Ave
- 420 Alegre Ave
- 0 Blume St Unit LOT 841607
- 0 Blume St Unit LOT 959710