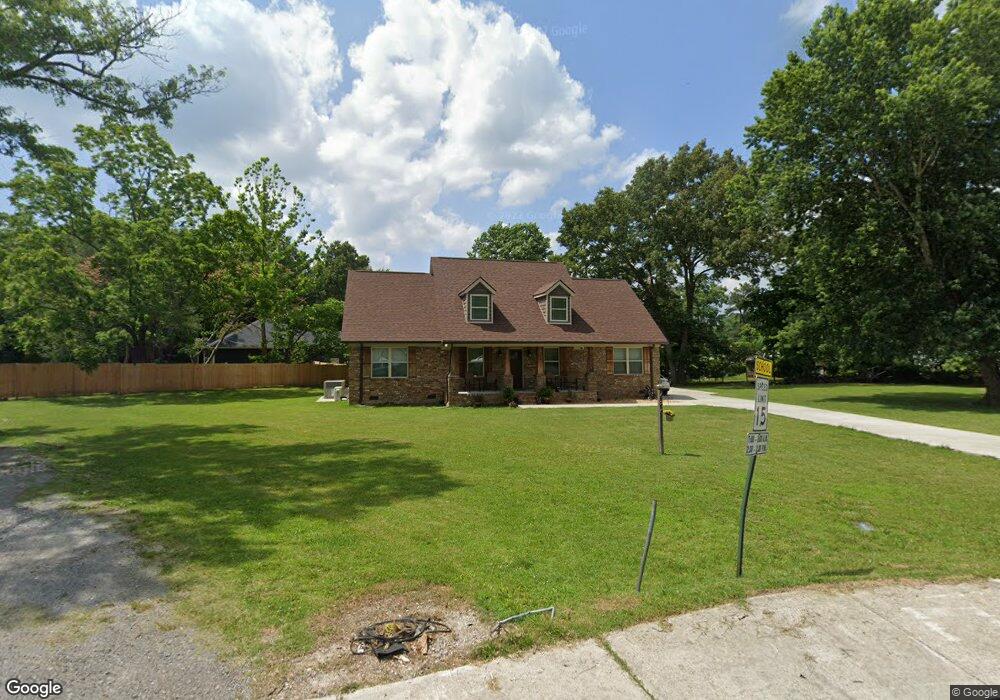
680 Lynchburg Rd Manchester, TN 37355
Estimated Value: $265,000 - $374,772
--
Bed
1
Bath
2,126
Sq Ft
$152/Sq Ft
Est. Value
About This Home
This home is located at 680 Lynchburg Rd, Manchester, TN 37355 and is currently estimated at $323,443, approximately $152 per square foot. 680 Lynchburg Rd is a home with nearby schools including Westwood Middle School and Temple Baptist Christian School.
Ownership History
Date
Name
Owned For
Owner Type
Purchase Details
Closed on
Nov 27, 2019
Sold by
Vado Julio Cesar and Vado Josefa Narvaez
Bought by
Vado Josefa Narvaez and Vado Maria J
Current Estimated Value
Purchase Details
Closed on
Dec 4, 2018
Sold by
Vado Luis E and Rocha Marian Jose
Bought by
Vado Maria
Purchase Details
Closed on
Oct 31, 2013
Sold by
Vado Julio Cesar
Bought by
Vado Luis E and Rocha Marian Jose
Purchase Details
Closed on
Oct 15, 2004
Sold by
Griggs Allen D
Bought by
Vado Julio Cesar
Purchase Details
Closed on
Jul 1, 2004
Bought by
Cesar Vado Julio and Narvaez Josefa
Create a Home Valuation Report for This Property
The Home Valuation Report is an in-depth analysis detailing your home's value as well as a comparison with similar homes in the area
Home Values in the Area
Average Home Value in this Area
Purchase History
| Date | Buyer | Sale Price | Title Company |
|---|---|---|---|
| Vado Josefa Narvaez | -- | None Available | |
| Vado Maria | -- | None Available | |
| Vado Luis E | -- | -- | |
| Vado Julio Cesar | $19,000 | -- | |
| Cesar Vado Julio | $19,000 | -- |
Source: Public Records
Tax History Compared to Growth
Tax History
| Year | Tax Paid | Tax Assessment Tax Assessment Total Assessment is a certain percentage of the fair market value that is determined by local assessors to be the total taxable value of land and additions on the property. | Land | Improvement |
|---|---|---|---|---|
| 2024 | $3,096 | $73,450 | $4,500 | $68,950 |
| 2023 | $3,096 | $73,450 | $0 | $0 |
| 2022 | $2,666 | $73,450 | $4,500 | $68,950 |
| 2021 | $2,691 | $58,775 | $3,750 | $55,025 |
| 2020 | $2,691 | $58,775 | $3,750 | $55,025 |
| 2019 | $1,321 | $58,775 | $3,750 | $55,025 |
| 2018 | $251 | $5,000 | $5,000 | $0 |
| 2017 | $286 | $5,450 | $5,000 | $450 |
| 2016 | $286 | $5,450 | $5,000 | $450 |
| 2015 | $286 | $5,450 | $5,000 | $450 |
| 2014 | $287 | $5,462 | $0 | $0 |
Source: Public Records
Map
Nearby Homes