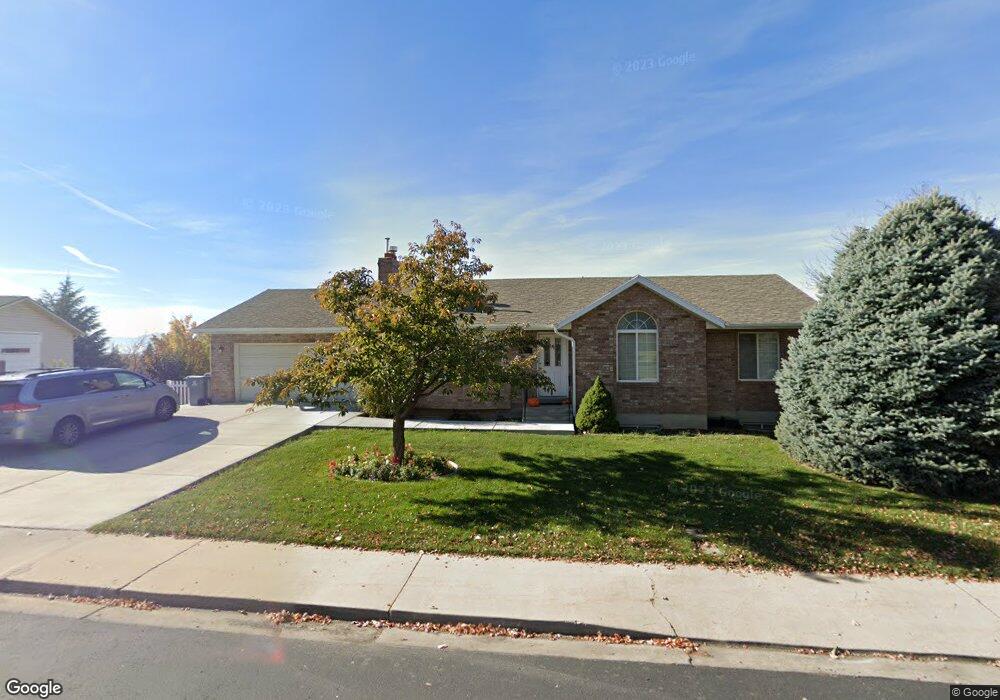
680 Mohawk Ave Pleasant Grove, UT 84062
Estimated Value: $457,000 - $549,000
3
Beds
2
Baths
1,172
Sq Ft
$440/Sq Ft
Est. Value
About This Home
This home is located at 680 Mohawk Ave, Pleasant Grove, UT 84062 and is currently estimated at $515,225, approximately $439 per square foot. 680 Mohawk Ave is a home located in Utah County with nearby schools including Central Elementary School, Oak Canyon Junior High School, and Pleasant Grove High School.
Ownership History
Date
Name
Owned For
Owner Type
Purchase Details
Closed on
Sep 4, 2019
Sold by
Liddle Alfred S and Liddle Jo Ann S
Bought by
Liddle Alfred S and Liddle Jo Ann S
Current Estimated Value
Home Financials for this Owner
Home Financials are based on the most recent Mortgage that was taken out on this home.
Original Mortgage
$35,000
Outstanding Balance
$30,720
Interest Rate
3.7%
Estimated Equity
$484,505
Purchase Details
Closed on
Sep 24, 2012
Sold by
Liddle Alfred Sorensen and Liddle Jo Ann Stevens
Bought by
Liddle Alfred S and Liddle Jo Ann S
Home Financials for this Owner
Home Financials are based on the most recent Mortgage that was taken out on this home.
Original Mortgage
$162,500
Interest Rate
3.59%
Mortgage Type
New Conventional
Purchase Details
Closed on
Dec 4, 1996
Sold by
Mohawk Trust
Bought by
Porter Dale L and Porter Helen Sue
Home Financials for this Owner
Home Financials are based on the most recent Mortgage that was taken out on this home.
Original Mortgage
$148,400
Interest Rate
7.86%
Create a Home Valuation Report for This Property
The Home Valuation Report is an in-depth analysis detailing your home's value as well as a comparison with similar homes in the area
Home Values in the Area
Average Home Value in this Area
Purchase History
| Date | Buyer | Sale Price | Title Company |
|---|---|---|---|
| Liddle Alfred S | -- | Meridian Title Company | |
| Liddle Alfred S | -- | Meridian Title Co | |
| Liddle Alfred S | -- | None Available | |
| Liddle Alfred Sorensen | -- | None Available | |
| Porter Dale L | -- | -- |
Source: Public Records
Mortgage History
| Date | Status | Borrower | Loan Amount |
|---|---|---|---|
| Open | Liddle Alfred S | $35,000 | |
| Previous Owner | Liddle Alfred Sorensen | $162,500 | |
| Previous Owner | Porter Dale L | $148,400 |
Source: Public Records
Tax History
| Year | Tax Paid | Tax Assessment Tax Assessment Total Assessment is a certain percentage of the fair market value that is determined by local assessors to be the total taxable value of land and additions on the property. | Land | Improvement |
|---|---|---|---|---|
| 2025 | $2,060 | $261,140 | -- | -- |
| 2024 | $2,060 | $245,905 | $0 | $0 |
| 2023 | $2,029 | $247,940 | $0 | $0 |
| 2022 | $2,330 | $283,305 | $0 | $0 |
| 2021 | $2,051 | $379,700 | $136,500 | $243,200 |
| 2020 | $1,879 | $341,000 | $121,900 | $219,100 |
| 2019 | $1,643 | $308,300 | $107,500 | $200,800 |
| 2018 | $1,550 | $275,000 | $100,400 | $174,600 |
| 2017 | $1,514 | $143,055 | $0 | $0 |
| 2016 | $1,384 | $126,225 | $0 | $0 |
| 2015 | $1,360 | $117,425 | $0 | $0 |
| 2014 | $1,354 | $115,830 | $0 | $0 |
Source: Public Records
Map
Nearby Homes
Your Personal Tour Guide
Ask me questions while you tour the home.