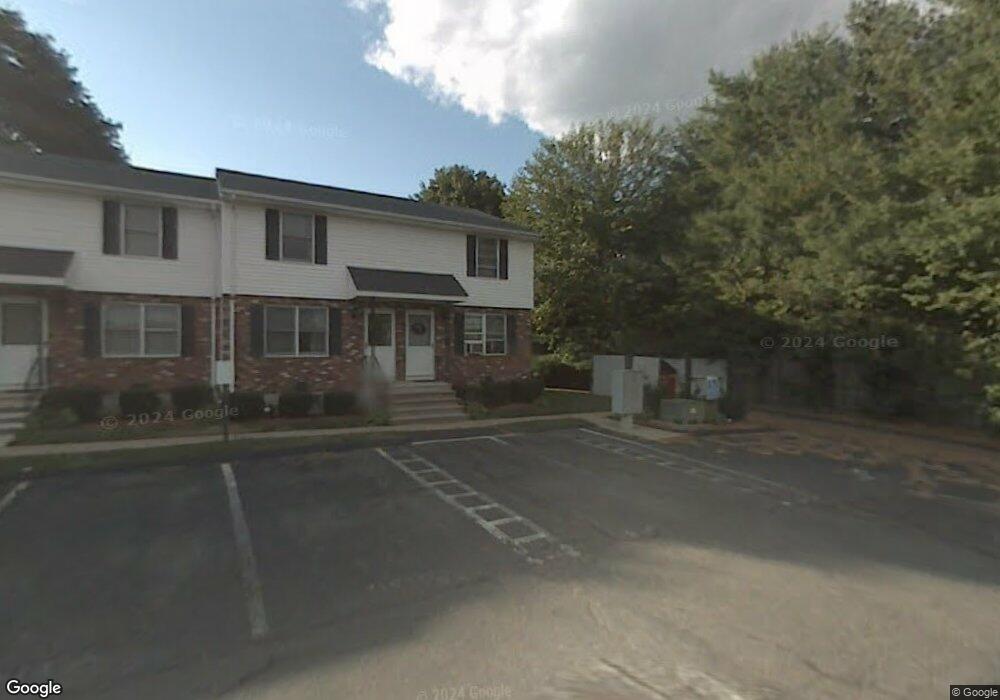
680 N Colony St Unit 8 Meriden, CT 06450
Estimated Value: $220,071 - $260,000
2
Beds
2
Baths
1,040
Sq Ft
$225/Sq Ft
Est. Value
About This Home
This home is located at 680 N Colony St Unit 8, Meriden, CT 06450 and is currently estimated at $233,518, approximately $224 per square foot. 680 N Colony St Unit 8 is a home located in New Haven County with nearby schools including John Barry School, Washington Middle School, and Francis T. Maloney High School.
Ownership History
Date
Name
Owned For
Owner Type
Purchase Details
Closed on
Nov 17, 2006
Sold by
Marshall Kevin G and Marshall Shannon R
Bought by
Musso Paul
Current Estimated Value
Home Financials for this Owner
Home Financials are based on the most recent Mortgage that was taken out on this home.
Original Mortgage
$134,100
Interest Rate
6.33%
Purchase Details
Closed on
Jan 17, 2002
Sold by
Terrusa Edward B and Terrusa Deborah J
Bought by
Marshall Kevin G and Mahoney Shannon R
Home Financials for this Owner
Home Financials are based on the most recent Mortgage that was taken out on this home.
Original Mortgage
$82,500
Interest Rate
2.75%
Purchase Details
Closed on
Mar 27, 1989
Sold by
W H Meyers & Sons
Bought by
Terrusa Edward B
Home Financials for this Owner
Home Financials are based on the most recent Mortgage that was taken out on this home.
Original Mortgage
$101,500
Interest Rate
10.49%
Create a Home Valuation Report for This Property
The Home Valuation Report is an in-depth analysis detailing your home's value as well as a comparison with similar homes in the area
Home Values in the Area
Average Home Value in this Area
Purchase History
| Date | Buyer | Sale Price | Title Company |
|---|---|---|---|
| Musso Paul | $149,000 | -- | |
| Marshall Kevin G | $87,500 | -- | |
| Terrusa Edward B | $112,900 | -- |
Source: Public Records
Mortgage History
| Date | Status | Borrower | Loan Amount |
|---|---|---|---|
| Open | Terrusa Edward B | $135,200 | |
| Closed | Terrusa Edward B | $134,100 | |
| Previous Owner | Terrusa Edward B | $82,500 | |
| Previous Owner | Terrusa Edward B | $101,500 |
Source: Public Records
Tax History Compared to Growth
Tax History
| Year | Tax Paid | Tax Assessment Tax Assessment Total Assessment is a certain percentage of the fair market value that is determined by local assessors to be the total taxable value of land and additions on the property. | Land | Improvement |
|---|---|---|---|---|
| 2025 | $2,773 | $73,150 | $0 | $73,150 |
| 2024 | $2,817 | $73,150 | $0 | $73,150 |
| 2023 | $2,715 | $73,150 | $0 | $73,150 |
| 2022 | $2,562 | $73,150 | $0 | $73,150 |
| 2021 | $3,038 | $69,790 | $0 | $69,790 |
| 2020 | $3,030 | $69,790 | $0 | $69,790 |
| 2019 | $3,004 | $69,790 | $0 | $69,790 |
| 2018 | $3,016 | $69,790 | $0 | $69,790 |
| 2017 | $2,935 | $69,790 | $0 | $69,790 |
| 2016 | $3,049 | $76,790 | $0 | $76,790 |
| 2015 | $2,977 | $76,790 | $0 | $76,790 |
| 2014 | $2,905 | $76,790 | $0 | $76,790 |
Source: Public Records
Map
Nearby Homes
- 109 Hicks St
- 181 Hicks St Unit 2C
- 51 Griswold St
- 882 N Colony Rd Unit 28
- 882 N Colony Rd Unit 61
- 882 N Colony Rd Unit 2
- 396 Gracey Ave
- 50 Quarry Farms Unit 48
- 334 Gracey Ave
- 303 Blackstone Village
- 69 Putnam St
- 53 Woodland St
- 52 Oakland Ct
- 929 N Colony Rd Unit 6
- 106 Blackstone Village Unit 106
- 387 Colony St
- 64 Fair St
- 497 Gracey Ave
- 145 Camp St
- 584 Gracey Ave
- 680 N Colony St Unit 9
- 680 N Colony St Unit 7
- 680 N Colony St Unit 6
- 680 N Colony St Unit 5
- 680 N Colony St Unit 44
- 680 N Colony St Unit 43
- 680 N Colony St Unit 42
- 680 N Colony St Unit 41
- 680 N Colony St Unit 40
- 680 N Colony St Unit 4
- 680 N Colony St Unit 39
- 680 N Colony St Unit 38
- 680 N Colony St Unit 37
- 680 N Colony St Unit 36
- 680 N Colony St Unit 35
- 680 N Colony St Unit 34
- 680 N Colony St Unit 33
- 680 N Colony St Unit 32
- 680 N Colony St Unit 31
- 680 N Colony St Unit 30