Estimated Value: $647,963 - $722,000
5
Beds
2
Baths
1,962
Sq Ft
$346/Sq Ft
Est. Value
About This Home
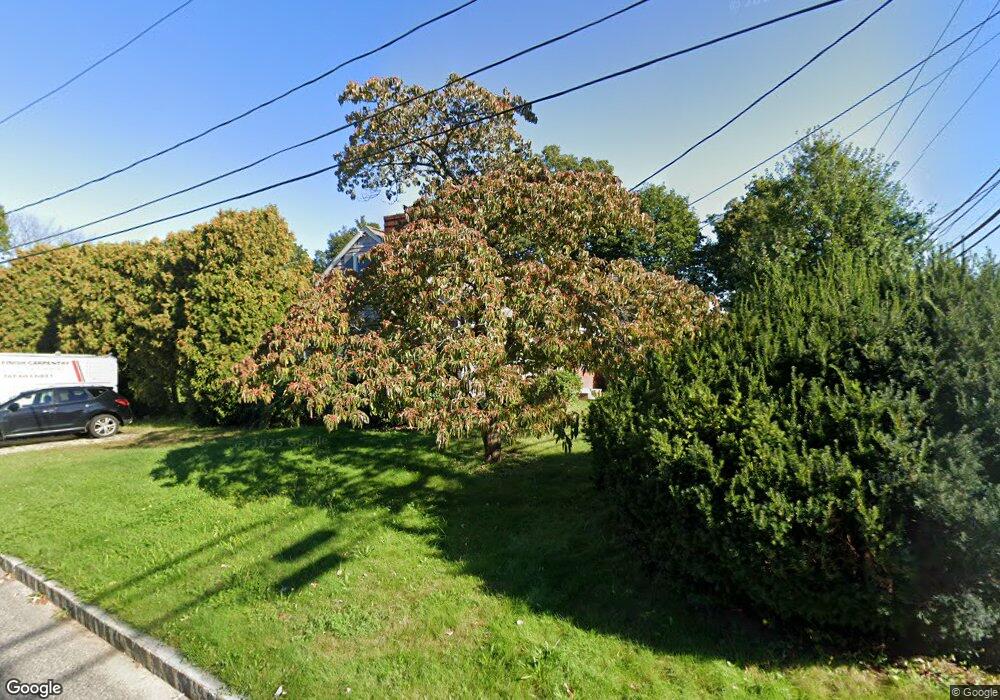
This home is located at 680 W Main St, Avon, MA 02322 and is currently estimated at $677,991, approximately $345 per square foot. 680 W Main St is a home located in Norfolk County with nearby schools including Ralph D. Butler Elementary School and Avon Middle/High School.
Ownership History
Date
Name
Owned For
Owner Type
Purchase Details
Closed on
Aug 26, 1993
Sold by
Orsula George W
Bought by
Arsenault John W and Arsenault Lisa M
Current Estimated Value
Home Financials for this Owner
Home Financials are based on the most recent Mortgage that was taken out on this home.
Original Mortgage
$122,500
Interest Rate
7.06%
Mortgage Type
Purchase Money Mortgage
Purchase Details
Closed on
Jun 20, 1989
Sold by
Oldrid Arthur E
Bought by
Orsula George W
Create a Home Valuation Report for This Property
The Home Valuation Report is an in-depth analysis detailing your home's value as well as a comparison with similar homes in the area
Home Values in the Area
Average Home Value in this Area
Purchase History
| Date | Buyer | Sale Price | Title Company |
|---|---|---|---|
| Arsenault John W | $128,500 | -- | |
| Orsula George W | $148,000 | -- |
Source: Public Records
Mortgage History
| Date | Status | Borrower | Loan Amount |
|---|---|---|---|
| Open | Orsula George W | $180,000 | |
| Closed | Orsula George W | $140,000 | |
| Closed | Orsula George W | $119,658 | |
| Closed | Orsula George W | $122,500 |
Source: Public Records
Tax History Compared to Growth
Tax History
| Year | Tax Paid | Tax Assessment Tax Assessment Total Assessment is a certain percentage of the fair market value that is determined by local assessors to be the total taxable value of land and additions on the property. | Land | Improvement |
|---|---|---|---|---|
| 2025 | $77 | $574,100 | $182,400 | $391,700 |
| 2024 | $7,200 | $513,200 | $163,700 | $349,500 |
| 2023 | $6,990 | $513,200 | $163,700 | $349,500 |
| 2022 | $7,094 | $448,700 | $136,500 | $312,200 |
| 2021 | $6,037 | $359,800 | $123,900 | $235,900 |
| 2020 | $5,818 | $328,700 | $110,700 | $218,000 |
| 2019 | $5,836 | $324,400 | $101,300 | $223,100 |
| 2018 | $5,953 | $320,900 | $101,300 | $219,600 |
| 2017 | $4,761 | $275,500 | $101,300 | $174,200 |
| 2016 | $5,152 | $301,100 | $104,300 | $196,800 |
| 2015 | $4,798 | $293,100 | $104,300 | $188,800 |
Source: Public Records
Map
Nearby Homes