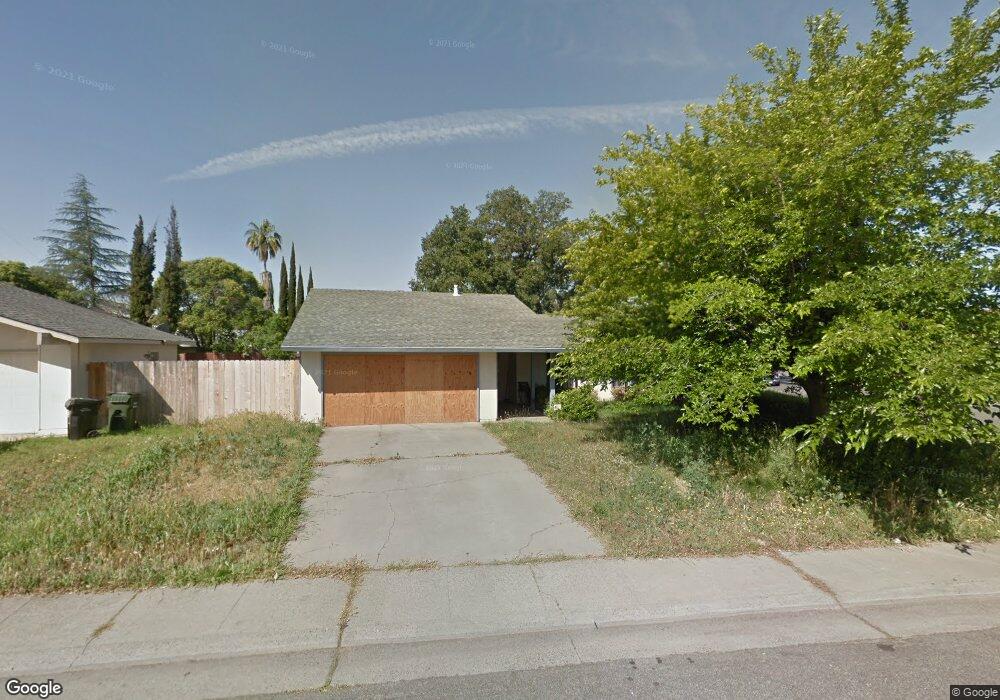
6800 Sandrock Way Sacramento, CA 95828
Estimated Value: $344,000 - $422,000
4
Beds
2
Baths
1,176
Sq Ft
$327/Sq Ft
Est. Value
About This Home
This home is located at 6800 Sandrock Way, Sacramento, CA 95828 and is currently estimated at $385,062, approximately $327 per square foot. 6800 Sandrock Way is a home located in Sacramento County with nearby schools including David Reese Elementary School, James Rutter Middle School, and Florin High School.
Ownership History
Date
Name
Owned For
Owner Type
Purchase Details
Closed on
Jul 28, 2014
Sold by
Pham Hung
Bought by
Bui The
Current Estimated Value
Purchase Details
Closed on
Jun 9, 2011
Sold by
Pacific Mortgage Servicing Lp
Bought by
Pham Hung
Home Financials for this Owner
Home Financials are based on the most recent Mortgage that was taken out on this home.
Original Mortgage
$88,880
Interest Rate
4.56%
Mortgage Type
FHA
Purchase Details
Closed on
Mar 18, 2011
Sold by
Inselman Ron and Inselman Jeanne M
Bought by
Pacific Mortgage Servicing
Purchase Details
Closed on
Mar 22, 2001
Sold by
Knight Patricia G
Bought by
Inselman Ron and Inselman Jeanne M
Home Financials for this Owner
Home Financials are based on the most recent Mortgage that was taken out on this home.
Original Mortgage
$149,300
Interest Rate
7.19%
Create a Home Valuation Report for This Property
The Home Valuation Report is an in-depth analysis detailing your home's value as well as a comparison with similar homes in the area
Home Values in the Area
Average Home Value in this Area
Purchase History
| Date | Buyer | Sale Price | Title Company |
|---|---|---|---|
| Bui The | -- | None Available | |
| Pham Hung | $110,000 | Chicago Title Company | |
| Pacific Mortgage Servicing | $81,000 | None Available | |
| Inselman Ron | $140,000 | Stewart Title |
Source: Public Records
Mortgage History
| Date | Status | Borrower | Loan Amount |
|---|---|---|---|
| Previous Owner | Pham Hung | $88,880 | |
| Previous Owner | Inselman Ron | $149,300 |
Source: Public Records
Tax History Compared to Growth
Tax History
| Year | Tax Paid | Tax Assessment Tax Assessment Total Assessment is a certain percentage of the fair market value that is determined by local assessors to be the total taxable value of land and additions on the property. | Land | Improvement |
|---|---|---|---|---|
| 2025 | $2,994 | $275,818 | $55,872 | $219,946 |
| 2024 | $2,994 | $270,411 | $54,777 | $215,634 |
| 2023 | $2,918 | $265,109 | $53,703 | $211,406 |
| 2022 | $2,868 | $259,911 | $52,650 | $207,261 |
| 2021 | $2,820 | $254,816 | $51,618 | $203,198 |
| 2020 | $2,782 | $252,204 | $51,089 | $201,115 |
| 2019 | $2,730 | $247,260 | $50,088 | $197,172 |
| 2018 | $2,656 | $242,412 | $49,106 | $193,306 |
| 2017 | $2,610 | $237,660 | $48,144 | $189,516 |
| 2016 | $2,467 | $233,000 | $47,200 | $185,800 |
| 2015 | $1,288 | $117,258 | $22,385 | $94,873 |
| 2014 | $1,267 | $114,962 | $21,947 | $93,015 |
Source: Public Records
Map
Nearby Homes
- 7312 Del Prado Way
- 6944 Mirador Way
- 7548 Lindale Dr
- 7413 Skander Way
- 6400 66th Ave Unit 21
- 7020 Sunnyslope Dr
- 6837 Southwood Way
- 7548 Huckleberry Ln
- 7551 Red Bud Ln
- 7451 Albezzia Ln
- 7825 Rockhurst Way
- 7442 Della Cir
- 6124 Pomegranate Ave
- 7206 Willowwest Ct
- 7633 Clement Cir
- 7928 Rockhurst Way
- 7605 Mctavish Cir
- 6104 Center Mall Way
- 7631 Verna Mae Ave
- 6990 Chris Ave
- 6804 Sandrock Way
- 7313 Del Coronado Way
- 7319 Del Coronado Way
- 7323 Del Coronado Way
- 6809 Ewing Way
- 6808 Sandrock Way
- 6805 Ewing Way
- 6814 Ewing Way
- 6813 Ewing Way
- 7327 Del Coronado Way
- 6801 Ewing Way
- 6809 Sandrock Way
- 6812 Sandrock Way
- 6817 Ewing Way
- 6820 Ewing Way
- 7331 Del Coronado Way
- 7434 Lindale Dr
- 7430 Lindale Dr Unit 3
- 6817 Sandrock Way
- 6823 Ewing Way