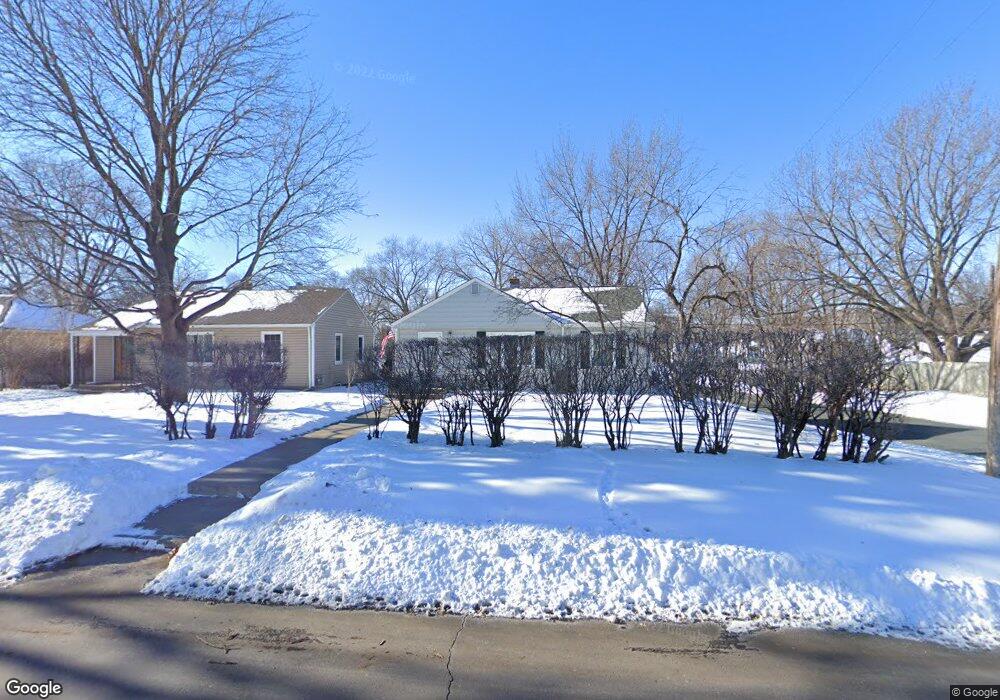
6800 Vincent Ave S Richfield, MN 55423
Estimated Value: $356,000 - $418,000
3
Beds
2
Baths
1,770
Sq Ft
$222/Sq Ft
Est. Value
About This Home
This home is located at 6800 Vincent Ave S, Richfield, MN 55423 and is currently estimated at $393,150, approximately $222 per square foot. 6800 Vincent Ave S is a home located in Hennepin County with nearby schools including Sheridan Hills Elementary School, Richfield Middle School, and Seven Hills Prep Academy.
Ownership History
Date
Name
Owned For
Owner Type
Purchase Details
Closed on
Mar 28, 2019
Sold by
Bailey John W
Bought by
Larrive Jennifer A
Current Estimated Value
Home Financials for this Owner
Home Financials are based on the most recent Mortgage that was taken out on this home.
Original Mortgage
$284,400
Outstanding Balance
$250,038
Interest Rate
4.3%
Mortgage Type
New Conventional
Estimated Equity
$143,112
Purchase Details
Closed on
Jun 20, 2018
Sold by
Sullivan Kelly
Bought by
Bailey John W
Purchase Details
Closed on
Oct 30, 2017
Sold by
Devries Properties & Design Llc
Bought by
Bailey John W and Sullivan Kelly
Home Financials for this Owner
Home Financials are based on the most recent Mortgage that was taken out on this home.
Original Mortgage
$275,615
Interest Rate
3.75%
Mortgage Type
FHA
Purchase Details
Closed on
Jun 2, 2017
Sold by
Cash For Houses Llc
Bought by
Devries Properties & Design Llc
Create a Home Valuation Report for This Property
The Home Valuation Report is an in-depth analysis detailing your home's value as well as a comparison with similar homes in the area
Home Values in the Area
Average Home Value in this Area
Purchase History
| Date | Buyer | Sale Price | Title Company |
|---|---|---|---|
| Larrive Jennifer A | $316,000 | Titlesmart Inc | |
| Bailey John W | -- | None Available | |
| Bailey John W | $280,700 | None Available | |
| Devries Properties & Design Llc | $170,000 | The Title Group Inc |
Source: Public Records
Mortgage History
| Date | Status | Borrower | Loan Amount |
|---|---|---|---|
| Open | Larrive Jennifer A | $284,400 | |
| Previous Owner | Bailey John W | $275,615 |
Source: Public Records
Tax History Compared to Growth
Tax History
| Year | Tax Paid | Tax Assessment Tax Assessment Total Assessment is a certain percentage of the fair market value that is determined by local assessors to be the total taxable value of land and additions on the property. | Land | Improvement |
|---|---|---|---|---|
| 2024 | $5,442 | $385,200 | $153,000 | $232,200 |
| 2023 | $5,104 | $371,800 | $139,500 | $232,300 |
| 2022 | $4,216 | $366,000 | $140,000 | $226,000 |
| 2021 | $4,100 | $304,000 | $113,000 | $191,000 |
| 2020 | $4,275 | $293,000 | $108,000 | $185,000 |
| 2019 | $4,090 | $292,000 | $107,000 | $185,000 |
| 2018 | $3,098 | $275,000 | $99,000 | $176,000 |
| 2017 | $2,600 | $190,000 | $83,000 | $107,000 |
| 2016 | $2,518 | $175,000 | $80,000 | $95,000 |
| 2015 | $2,313 | $165,000 | $70,000 | $95,000 |
| 2014 | -- | $149,000 | $73,000 | $76,000 |
Source: Public Records
Map
Nearby Homes
- 6836 Upton Ave S
- 6640 Vincent Ave S
- 2605 W 66th St
- 3209 Galleria Unit 804
- 3209 Galleria Unit 1808
- 6533 Thomas Ave S
- 2508 W 70 1/2 St
- 6450 York Ave S Unit 302
- 6450 York Ave S Unit 518
- 6450 York Ave S Unit 308
- 6400 Vincent Ave S
- 6945 Oliver Ave S
- 6347 Barrie Rd
- 6371 Barrie Rd
- 7200 York Ave S Unit 220
- 6400 York Ave S Unit 512
- 6919 Newton Ave S
- 6315 York Ave S Unit 201
- 6315 York Ave S Unit 203
- 6301 York Ave S Unit 102
- 6804 Vincent Ave S
- 6808 Vincent Ave S
- 6744 Vincent Ave S
- 6801 Washburn Ave S
- 6805 Washburn Ave S
- 6812 Vincent Ave S
- 6740 Vincent Ave S
- 6809 Washburn Ave S
- 6801 Vincent Ave S
- 6816 Vincent Ave S
- 6805 Vincent Ave S
- 6813 Washburn Ave S
- 6736 Vincent Ave S
- 6809 Vincent Ave S
- 6745 Vincent Ave S
- 6817 Washburn Ave S
- 6737 Washburn Ave S
- 6813 Vincent Ave S
- 6820 Vincent Ave S
- 6741 Vincent Ave S