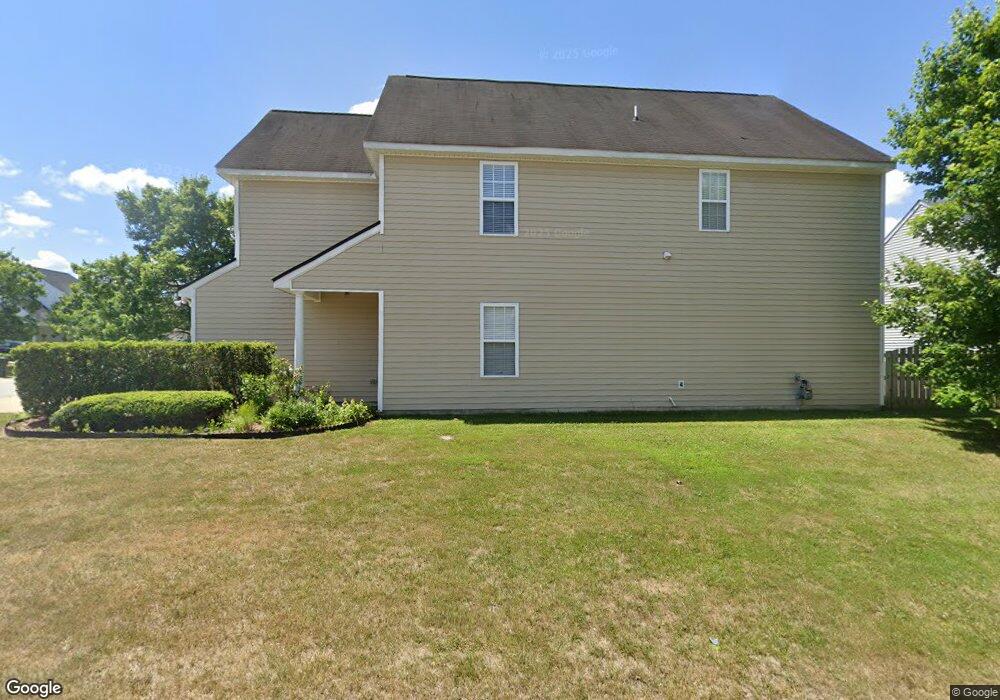
6803 Spanglers Spring Way Raleigh, NC 27610
Southeast Raleigh NeighborhoodEstimated Value: $345,000 - $369,000
--
Bed
3
Baths
2,260
Sq Ft
$157/Sq Ft
Est. Value
About This Home
This home is located at 6803 Spanglers Spring Way, Raleigh, NC 27610 and is currently estimated at $354,608, approximately $156 per square foot. 6803 Spanglers Spring Way is a home located in Wake County with nearby schools including Barwell Road Elementary School, East Garner Middle School, and South Garner High.
Ownership History
Date
Name
Owned For
Owner Type
Purchase Details
Closed on
Aug 5, 2013
Sold by
Federal National Mortgage Association
Bought by
Bagley Louise L
Current Estimated Value
Home Financials for this Owner
Home Financials are based on the most recent Mortgage that was taken out on this home.
Original Mortgage
$142,373
Interest Rate
4.39%
Mortgage Type
FHA
Purchase Details
Closed on
Sep 28, 2006
Sold by
Phoenix Builders Inc
Bought by
Harris Angela B and Mclean Jerry D
Home Financials for this Owner
Home Financials are based on the most recent Mortgage that was taken out on this home.
Original Mortgage
$174,250
Interest Rate
6.48%
Mortgage Type
Purchase Money Mortgage
Purchase Details
Closed on
Sep 8, 2005
Sold by
Griffis Glen Llc
Bought by
Phoenix Builders Inc
Create a Home Valuation Report for This Property
The Home Valuation Report is an in-depth analysis detailing your home's value as well as a comparison with similar homes in the area
Home Values in the Area
Average Home Value in this Area
Purchase History
| Date | Buyer | Sale Price | Title Company |
|---|---|---|---|
| Bagley Louise L | -- | None Available | |
| Harris Angela B | $175,000 | None Available | |
| Phoenix Builders Inc | $640,000 | None Available |
Source: Public Records
Mortgage History
| Date | Status | Borrower | Loan Amount |
|---|---|---|---|
| Previous Owner | Bagley Louise L | $142,373 | |
| Previous Owner | Harris Angela B | $174,250 |
Source: Public Records
Tax History Compared to Growth
Tax History
| Year | Tax Paid | Tax Assessment Tax Assessment Total Assessment is a certain percentage of the fair market value that is determined by local assessors to be the total taxable value of land and additions on the property. | Land | Improvement |
|---|---|---|---|---|
| 2025 | $3,165 | $360,577 | $65,000 | $295,577 |
| 2024 | $3,152 | $360,577 | $65,000 | $295,577 |
| 2023 | $2,425 | $220,641 | $41,000 | $179,641 |
| 2022 | $2,254 | $220,641 | $41,000 | $179,641 |
| 2021 | $2,167 | $220,641 | $41,000 | $179,641 |
| 2020 | $2,128 | $220,641 | $41,000 | $179,641 |
| 2019 | $2,071 | $176,971 | $28,000 | $148,971 |
| 2018 | $1,954 | $176,971 | $28,000 | $148,971 |
| 2017 | $1,861 | $176,971 | $28,000 | $148,971 |
| 2016 | $1,823 | $176,971 | $28,000 | $148,971 |
| 2015 | $1,847 | $176,461 | $36,000 | $140,461 |
| 2014 | $1,752 | $176,461 | $36,000 | $140,461 |
Source: Public Records
Map
Nearby Homes
- 7101 Battle Bridge Rd
- 6604 Frogstool Ln
- 3836 Griffis Glen Dr
- 4342 Bay Rum Ln
- 6839 Harter Ct Unit 35
- 6839 Harter Ct
- 6863 Paint Rock Ln
- 6848 Horseback Ln
- 6520 Bunker Hill Dr
- 6516 Battle Bridge Rd
- Litchfield Plan at Battle Bridge
- Winchester Plan at Battle Bridge
- Rochester Plan at Battle Bridge
- 6005 Namozine Ct
- 6408 Bunker Hill Dr
- 6447 Granite Quarry Dr
- 6445 Granite Quarry Dr
- 6411 Granite Quarry Dr
- 4009 Patriot Ridge Ct
- 6407 Granite Quarry Dr
- 4038 Alder Grove Ln
- 4034 Alder Grove Ln
- 6807 Spanglers Spring Way
- 4042 Alder Grove Ln
- 6802 Spanglers Spring Way
- 6811 Spanglers Spring Way
- 6806 Spanglers Spring Way
- 4033 Alder Grove Ln
- 4037 Alder Grove Ln
- 4029 Alder Grove Ln
- 4041 Alder Grove Ln
- 7021 Barlows Knoll St Unit 43
- 7021 Barlows Knoll St
- 6810 Spanglers Spring Way
- 6815 Spanglers Spring Way
- 7027 Barlows Knoll St
- 4020 Alder Grove Ln
- 4025 Alder Grove Ln
- 4045 Alder Grove Ln
- 6814 Spanglers Spring Way