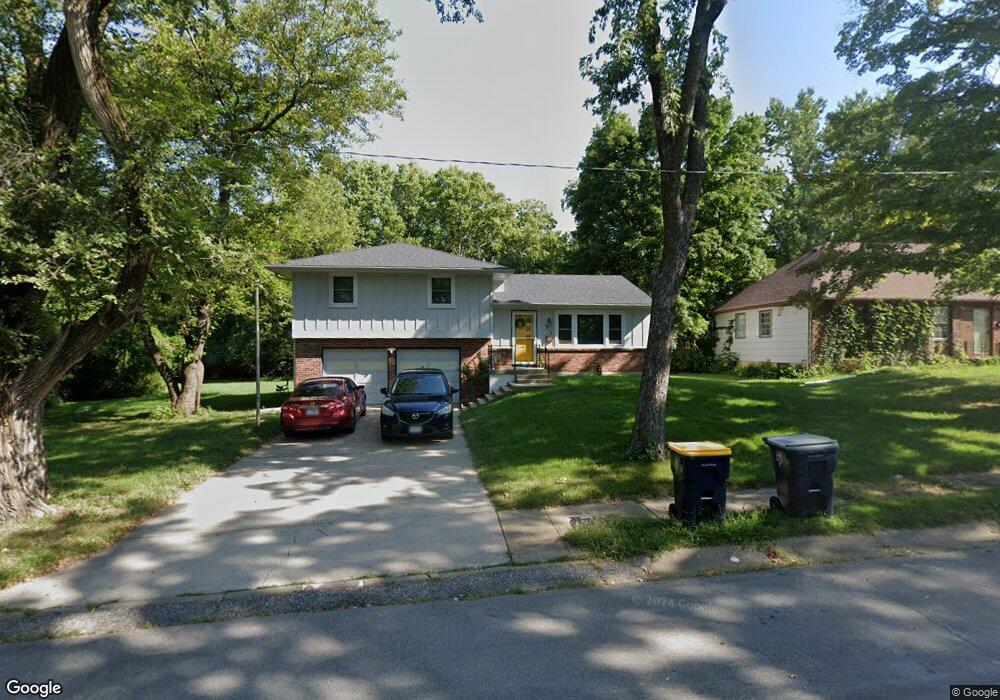
6804 E 85th Terrace Kansas City, MO 64138
Oldham Farms NeighborhoodEstimated Value: $154,763 - $186,000
3
Beds
1
Bath
1,128
Sq Ft
$151/Sq Ft
Est. Value
About This Home
This home is located at 6804 E 85th Terrace, Kansas City, MO 64138 and is currently estimated at $170,691, approximately $151 per square foot. 6804 E 85th Terrace is a home located in Jackson County with nearby schools including Santa Fe Elementary School, Carver Christian Academy, and St Regis School.
Ownership History
Date
Name
Owned For
Owner Type
Purchase Details
Closed on
Nov 21, 2005
Sold by
Hale Carla S
Bought by
Lewis Richard E
Current Estimated Value
Home Financials for this Owner
Home Financials are based on the most recent Mortgage that was taken out on this home.
Original Mortgage
$85,600
Outstanding Balance
$49,888
Interest Rate
7.1%
Mortgage Type
Fannie Mae Freddie Mac
Estimated Equity
$120,803
Purchase Details
Closed on
Aug 30, 2002
Sold by
Washington Latisha K
Bought by
Hale Carla S
Home Financials for this Owner
Home Financials are based on the most recent Mortgage that was taken out on this home.
Original Mortgage
$82,336
Interest Rate
6.25%
Mortgage Type
Purchase Money Mortgage
Purchase Details
Closed on
Apr 27, 1998
Sold by
Eileen Deville Randall Clint
Bought by
Washington Latisha K
Home Financials for this Owner
Home Financials are based on the most recent Mortgage that was taken out on this home.
Original Mortgage
$64,600
Interest Rate
7.09%
Mortgage Type
Purchase Money Mortgage
Create a Home Valuation Report for This Property
The Home Valuation Report is an in-depth analysis detailing your home's value as well as a comparison with similar homes in the area
Home Values in the Area
Average Home Value in this Area
Purchase History
| Date | Buyer | Sale Price | Title Company |
|---|---|---|---|
| Lewis Richard E | -- | Ctic | |
| Hale Carla S | -- | -- | |
| Washington Latisha K | -- | Chicago Title Insurance Co |
Source: Public Records
Mortgage History
| Date | Status | Borrower | Loan Amount |
|---|---|---|---|
| Open | Lewis Richard E | $85,600 | |
| Previous Owner | Hale Carla S | $82,336 | |
| Previous Owner | Washington Latisha K | $64,600 |
Source: Public Records
Tax History Compared to Growth
Tax History
| Year | Tax Paid | Tax Assessment Tax Assessment Total Assessment is a certain percentage of the fair market value that is determined by local assessors to be the total taxable value of land and additions on the property. | Land | Improvement |
|---|---|---|---|---|
| 2025 | $1,427 | $16,834 | $2,751 | $14,083 |
| 2024 | $1,402 | $16,488 | $984 | $15,504 |
| 2023 | $1,402 | $16,488 | $851 | $15,637 |
| 2022 | $1,261 | $12,730 | $3,109 | $9,621 |
| 2021 | $1,087 | $12,730 | $3,109 | $9,621 |
| 2020 | $1,152 | $12,754 | $3,109 | $9,645 |
| 2019 | $1,090 | $12,754 | $3,109 | $9,645 |
| 2018 | $1,016 | $11,100 | $2,706 | $8,394 |
| 2017 | $1,020 | $11,100 | $2,706 | $8,394 |
| 2016 | $1,020 | $10,822 | $1,957 | $8,865 |
| 2014 | $979 | $10,507 | $1,900 | $8,607 |
Source: Public Records
Map
Nearby Homes
- 6906 E 86th St
- 8604 Corrington Ave
- 8704 Manchester Ave
- 9250 Blue Ridge Blvd
- 7809 E 87th St
- 7814 E 86th St
- 8803 Manchester Ave
- 8400 Blue Ridge Blvd
- 7413 Loma Vista Dr
- 8416 Greenwood Rd
- 8021 E 88th St
- 8902 Manchester Ave
- 9204 Blue Ridge Blvd
- 7701 E 90th Terrace
- 7718 E 90th Terrace
- 7722 E 90th Terrace
- 8005 E 90th St
- 9227 Eastern Ave
- 8115 E 80th Terrace
- 7800 E 91st St
- 6806 E 85th Terrace
- 6808 E 85th Terrace
- 6805 E 85th Terrace
- 6807 E 85th Terrace
- 6809 E 85th Terrace
- 6900 E 85th Terrace
- 6901 E 85th Terrace
- 6902 E 85th Terrace
- 6804 E 86th St
- 6806 E 86th St
- 6903 E 85th Terrace
- 6808 E 86th St
- 6900 E 86th St
- 6902 E 86th St
- 6908 E 85th Terrace
- 6907 E 85th Terrace
- 8601 Cambridge Ave
- 8600 Cambridge Ave
- 6909 E 85th Terrace
- 8602 Cambridge Ave