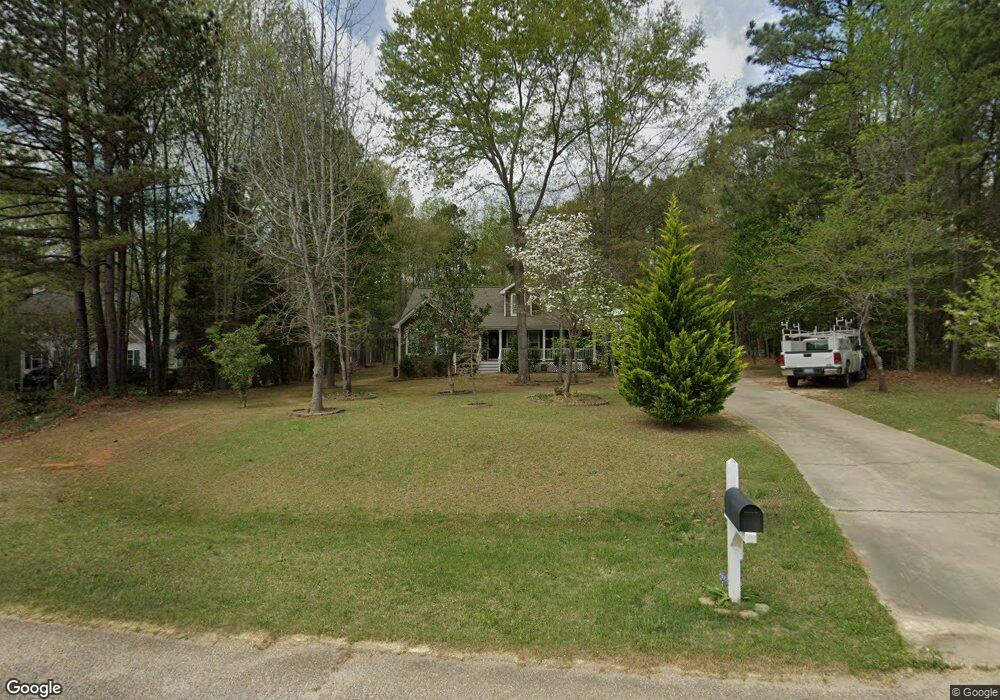
6804 Vernie Dr Raleigh, NC 27603
Estimated Value: $420,000 - $454,000
3
Beds
2
Baths
1,587
Sq Ft
$276/Sq Ft
Est. Value
About This Home
This home is located at 6804 Vernie Dr, Raleigh, NC 27603 and is currently estimated at $438,418, approximately $276 per square foot. 6804 Vernie Dr is a home located in Wake County with nearby schools including North Garner Middle and Garner High.
Ownership History
Date
Name
Owned For
Owner Type
Purchase Details
Closed on
Feb 7, 2014
Sold by
Nationstar Mortgage Llc
Bought by
Santiago Sandoval Roberto F
Current Estimated Value
Purchase Details
Closed on
Dec 3, 2013
Sold by
Muiter Bradley S and Muiter Roslynn
Bought by
Nationstar Mortgage Llc
Purchase Details
Closed on
Apr 23, 2008
Sold by
Demott Daniel R and Demott Lisa J
Bought by
Muiter Bradley and Muiter Roslynn
Home Financials for this Owner
Home Financials are based on the most recent Mortgage that was taken out on this home.
Original Mortgage
$170,340
Interest Rate
6.08%
Mortgage Type
Purchase Money Mortgage
Purchase Details
Closed on
Dec 31, 1998
Sold by
M R Wells Custom Homes Llc
Bought by
Demott Daniel R and Demott Lisa J
Home Financials for this Owner
Home Financials are based on the most recent Mortgage that was taken out on this home.
Original Mortgage
$136,871
Interest Rate
6.87%
Mortgage Type
FHA
Create a Home Valuation Report for This Property
The Home Valuation Report is an in-depth analysis detailing your home's value as well as a comparison with similar homes in the area
Home Values in the Area
Average Home Value in this Area
Purchase History
| Date | Buyer | Sale Price | Title Company |
|---|---|---|---|
| Santiago Sandoval Roberto F | $55,000 | None Available | |
| Nationstar Mortgage Llc | $120,000 | None Available | |
| Muiter Bradley | $167,000 | None Available | |
| Demott Daniel R | $138,000 | -- |
Source: Public Records
Mortgage History
| Date | Status | Borrower | Loan Amount |
|---|---|---|---|
| Previous Owner | Muiter Bradley | $170,340 | |
| Previous Owner | Demott Daniel R | $136,871 |
Source: Public Records
Tax History Compared to Growth
Tax History
| Year | Tax Paid | Tax Assessment Tax Assessment Total Assessment is a certain percentage of the fair market value that is determined by local assessors to be the total taxable value of land and additions on the property. | Land | Improvement |
|---|---|---|---|---|
| 2025 | $2,683 | $416,303 | $80,000 | $336,303 |
| 2024 | $2,605 | $416,303 | $80,000 | $336,303 |
| 2023 | $2,155 | $273,761 | $46,000 | $227,761 |
| 2022 | $1,997 | $273,761 | $46,000 | $227,761 |
| 2021 | $1,944 | $273,761 | $46,000 | $227,761 |
| 2020 | $1,912 | $273,761 | $46,000 | $227,761 |
| 2019 | $1,680 | $203,313 | $42,000 | $161,313 |
| 2018 | $1,546 | $203,313 | $42,000 | $161,313 |
| 2017 | $1,466 | $203,313 | $42,000 | $161,313 |
| 2016 | $1,436 | $203,313 | $42,000 | $161,313 |
| 2015 | $1,457 | $170,093 | $44,000 | $126,093 |
| 2014 | $1,139 | $170,093 | $44,000 | $126,093 |
Source: Public Records
Map
Nearby Homes
- 392 Travel Lite Dr
- 272 Travel Lite Dr
- 120 Line Dr
- 6908 Longridge Dr
- 1153 Polo Dr
- 408 Johnston Rd
- 170 Sallyport Ct
- 6408 Glen Brack Ct
- 221 Old Hickory Dr
- 595 Durwood Dr
- 618 Durwood Dr
- 4212 Rockside Hills Dr
- 6313 Southern Charm Ln
- 6257 Oak Passage Dr
- 7508 Frasier Fir Place
- 212 Fox Pen Dr
- 6121 Catandpolly Ln
- 48 Banbury Ct
- 6009 Swales Way
- 401 Blackberry Creek Dr
- 6808 Vernie Dr
- 6800 Vernie Dr
- 1000 Stallings Glen Rd
- 6812 Vernie Dr
- 6801 Vernie Dr
- 6813 Vernie Dr
- 6805 Vernie Dr
- 6809 Vernie Dr
- 1005 Stallings Glen Ln
- 1001 Stallings Glen Ln
- 1005 Stallings Glen Rd
- 1001 Stallings Glen Rd
- 1012 Stallings Glen Rd
- 6917 Pinnacle Ridge Rd
- 1005 Highlander Dr
- 1013 Highlander Dr
- 6912 Oviedo Dr
- 1017 Highlander Dr
- 6904 Oviedo Dr
- 6732 Vernie Dr