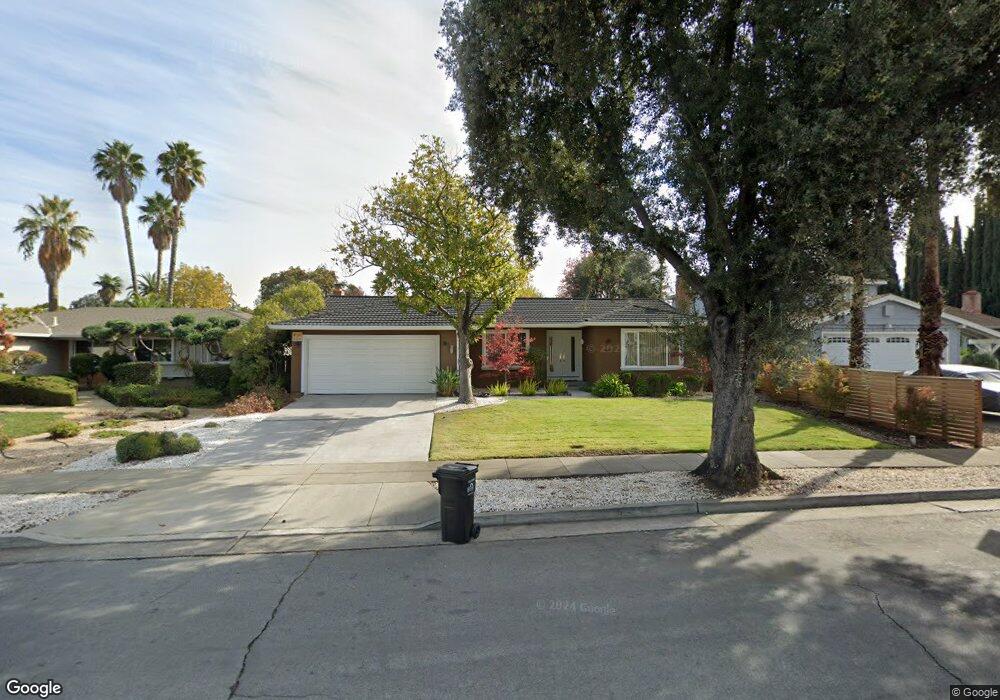
6807 Trinidad Dr San Jose, CA 95120
Shadow Brook I NeighborhoodEstimated Value: $2,007,422 - $2,406,000
4
Beds
2
Baths
1,898
Sq Ft
$1,136/Sq Ft
Est. Value
About This Home
This home is located at 6807 Trinidad Dr, San Jose, CA 95120 and is currently estimated at $2,155,606, approximately $1,135 per square foot. 6807 Trinidad Dr is a home located in Santa Clara County with nearby schools including Graystone Elementary School, Bret Harte Middle School, and Leland High School.
Ownership History
Date
Name
Owned For
Owner Type
Purchase Details
Closed on
Apr 6, 2023
Sold by
Mai Cong Duc
Bought by
Mai Revocable Living Trust
Current Estimated Value
Purchase Details
Closed on
Nov 14, 2003
Sold by
Vu Khanh Kim
Bought by
Mai Cong D
Home Financials for this Owner
Home Financials are based on the most recent Mortgage that was taken out on this home.
Original Mortgage
$542,000
Interest Rate
3.74%
Mortgage Type
Balloon
Purchase Details
Closed on
Oct 30, 2002
Sold by
Cheng I Ming and Cheng Hsiu Li
Bought by
Mai Cong D
Home Financials for this Owner
Home Financials are based on the most recent Mortgage that was taken out on this home.
Original Mortgage
$484,000
Interest Rate
5.89%
Purchase Details
Closed on
Oct 22, 2001
Sold by
Cheng I Ming
Bought by
Cheng I Ming and Cheng Hsiu Li
Purchase Details
Closed on
Apr 25, 2001
Sold by
Cheng Ying Ying
Bought by
Cheng I Ming
Create a Home Valuation Report for This Property
The Home Valuation Report is an in-depth analysis detailing your home's value as well as a comparison with similar homes in the area
Home Values in the Area
Average Home Value in this Area
Purchase History
| Date | Buyer | Sale Price | Title Company |
|---|---|---|---|
| Mai Revocable Living Trust | -- | -- | |
| Mai Cong D | -- | Stewart Title Of California | |
| Mai Cong D | -- | Old Republic Title Company | |
| Cheng I Ming | -- | -- | |
| Cheng I Ming | -- | -- | |
| Cheng I Ming | -- | -- |
Source: Public Records
Mortgage History
| Date | Status | Borrower | Loan Amount |
|---|---|---|---|
| Previous Owner | Mai Cong D | $542,000 | |
| Previous Owner | Mai Cong D | $484,000 | |
| Closed | Mai Cong D | $60,500 |
Source: Public Records
Tax History Compared to Growth
Tax History
| Year | Tax Paid | Tax Assessment Tax Assessment Total Assessment is a certain percentage of the fair market value that is determined by local assessors to be the total taxable value of land and additions on the property. | Land | Improvement |
|---|---|---|---|---|
| 2025 | $11,443 | $883,186 | $550,358 | $332,828 |
| 2024 | $11,443 | $865,869 | $539,567 | $326,302 |
| 2023 | $11,219 | $848,892 | $528,988 | $319,904 |
| 2022 | $11,122 | $832,248 | $518,616 | $313,632 |
| 2021 | $10,887 | $815,931 | $508,448 | $307,483 |
| 2020 | $10,636 | $807,566 | $503,235 | $304,331 |
| 2019 | $10,406 | $791,732 | $493,368 | $298,364 |
| 2018 | $10,299 | $776,209 | $483,695 | $292,514 |
| 2017 | $10,214 | $760,990 | $474,211 | $286,779 |
| 2016 | $9,958 | $740,187 | $464,913 | $275,274 |
| 2015 | $9,890 | $729,070 | $457,930 | $271,140 |
| 2014 | $9,433 | $714,789 | $448,960 | $265,829 |
Source: Public Records
Map
Nearby Homes
- 6805 Almaden Rd
- 6803 Lenwood Way
- 6628 Wildwood Ct
- 6698 Charter Oak Place
- 1122 Hearth Ct
- 1171 Wilhelmina Way
- 6579 Cooperage Ct
- 6605 Bret Harte Dr
- 1174 Old Oak Dr
- 6840 Hampton Dr
- 6565 Stonehill Dr
- 6421 Montana Ct
- 6997 Elwood Rd
- 18950 Graystone Ln
- 0 Hill Ln
- 1238 Wooded Hills Dr
- 1140 Mallard Ridge Loop
- 6898 Shearwater Dr
- 7111 Echo Loop
- 7025 Bret Harte Dr
- 6811 Trinidad Dr
- 6803 Trinidad Dr
- 6765 Mount Leneve Dr
- 6815 Trinidad Dr
- 6761 Mount Leneve Dr
- 6755 Mount Leneve Dr
- 6808 Trinidad Dr
- 6819 Trinidad Dr
- 6812 Trinidad Dr
- 6804 Trinidad Dr
- 6743 Mount Leneve Dr
- 6816 Trinidad Dr
- 6823 Trinidad Dr
- 6820 Trinidad Dr
- 6773 Almaden Rd
- 6731 Mount Leneve Dr
- 6768 Mount Leneve Dr
- 6694 Mount Holly Dr
- 6758 Mount Leneve Dr