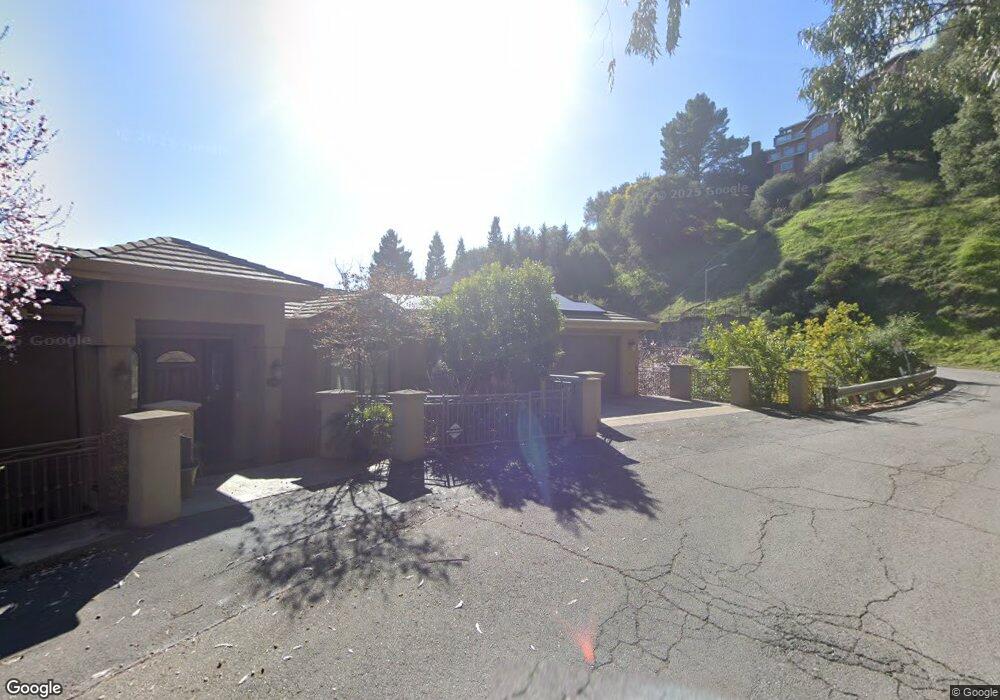
6808 Charing Cross Rd Berkeley, CA 94705
Claremont Hills NeighborhoodEstimated Value: $1,891,000 - $2,398,000
5
Beds
4
Baths
3,450
Sq Ft
$592/Sq Ft
Est. Value
About This Home
This home is located at 6808 Charing Cross Rd, Berkeley, CA 94705 and is currently estimated at $2,041,062, approximately $591 per square foot. 6808 Charing Cross Rd is a home located in Alameda County with nearby schools including Chabot Elementary School, Thornhill Elementary School, and Claremont Middle School.
Ownership History
Date
Name
Owned For
Owner Type
Purchase Details
Closed on
Nov 11, 2008
Sold by
Cheung Chung Kit and Cheung Yin Kwan
Bought by
Tan Tommy Chintju and Wong Mei Yu
Current Estimated Value
Home Financials for this Owner
Home Financials are based on the most recent Mortgage that was taken out on this home.
Original Mortgage
$729,000
Outstanding Balance
$478,296
Interest Rate
6.07%
Mortgage Type
Purchase Money Mortgage
Estimated Equity
$1,562,766
Purchase Details
Closed on
Aug 4, 2008
Sold by
Cheung Chung Kit
Bought by
Cheung Chung Kit and Cheung Yin Kwan
Purchase Details
Closed on
Oct 18, 2005
Sold by
Cheung Chung Kit and Cheung Yin K
Bought by
Cheung Chung Kit
Home Financials for this Owner
Home Financials are based on the most recent Mortgage that was taken out on this home.
Original Mortgage
$910,000
Interest Rate
5.67%
Mortgage Type
Construction
Purchase Details
Closed on
Jan 21, 2005
Sold by
Chang Henry and Chang Constance P
Bought by
Cheung Chang Kit and Cheung Yin K
Create a Home Valuation Report for This Property
The Home Valuation Report is an in-depth analysis detailing your home's value as well as a comparison with similar homes in the area
Home Values in the Area
Average Home Value in this Area
Purchase History
| Date | Buyer | Sale Price | Title Company |
|---|---|---|---|
| Tan Tommy Chintju | $1,100,000 | Fidelity National Title Co | |
| Cheung Chung Kit | -- | None Available | |
| Cheung Chung Kit | -- | Commonwealth Land Title | |
| Cheung Chung Kit | -- | Commonwealth Land Title Co | |
| Cheung Chang Kit | $241,500 | Commonwealth Land Title |
Source: Public Records
Mortgage History
| Date | Status | Borrower | Loan Amount |
|---|---|---|---|
| Open | Tan Tommy Chintju | $729,000 | |
| Previous Owner | Cheung Chung Kit | $910,000 |
Source: Public Records
Tax History
| Year | Tax Paid | Tax Assessment Tax Assessment Total Assessment is a certain percentage of the fair market value that is determined by local assessors to be the total taxable value of land and additions on the property. | Land | Improvement |
|---|---|---|---|---|
| 2025 | $19,639 | $1,409,436 | $424,931 | $991,505 |
| 2024 | $19,639 | $1,381,672 | $416,601 | $972,071 |
| 2023 | $20,731 | $1,361,447 | $408,434 | $953,013 |
| 2022 | $20,376 | $1,327,761 | $400,428 | $934,333 |
| 2021 | $19,803 | $1,301,592 | $392,577 | $916,015 |
| 2020 | $19,583 | $1,295,183 | $388,555 | $906,628 |
| 2019 | $18,992 | $1,269,795 | $380,938 | $888,857 |
| 2018 | $18,592 | $1,244,902 | $373,470 | $871,432 |
| 2017 | $17,929 | $1,220,493 | $366,148 | $854,345 |
| 2016 | $17,478 | $1,196,568 | $358,970 | $837,598 |
| 2015 | $17,383 | $1,178,605 | $353,581 | $825,024 |
| 2014 | $17,540 | $1,155,527 | $346,658 | $808,869 |
Source: Public Records
Map
Nearby Homes
- 6839 Sherwick Dr
- 6716 Charing Cross Rd
- 1881 Grand View Dr
- 320 Caldecott Ln Unit 127
- 320 Caldecott Ln Unit 116
- 6971 Bristol Dr
- 280 Caldecott Ln Unit 221
- 180 Caldecott Ln Unit 314
- 0 Buckingham Blvd Unit 41115384
- 7003 Buckingham Blvd
- 7041 Devon Way
- 11 Hawks Hill Ct
- 0 Tunnel Rd Unit 41087686
- 0 Tunnel Rd Unit 41085045
- 7084 Westmoorland Dr
- 1426 Grand View Dr
- 1102 Grand View Dr
- 29 Live Oak Rd
- 5 Woodside Way
- 0 Dartmouth Dr
- 6811 Charing Cross Rd
- 6813 Charing Cross Rd
- 6815 Charing Cross Rd
- 6808 Charing Cross Rd
- 6788 Charing Cross Rd
- lot115 Charing Cross Rd
- lot116 Charing Cross Rd
- 6951 Charing Cross Rd
- 6750 Charing Cross Rd
- 6818 Charing Cross Rd
- 6818 Charing Cross Rd
- 6811 Charing Cross Rd
- 6813 Charing Cross Rd
- 6815 Charing Cross Rd
- 6728 Charing Cross Rd
- 6728 Charing Cross Rd
- 6822 Charing Cross Rd
- 0 Charing Cross Rd Unit 40685236
- 0 Charing Cross Rd Unit 40685232
- 0 Charing Cross Rd Unit 40685227
Your Personal Tour Guide
Ask me questions while you tour the home.