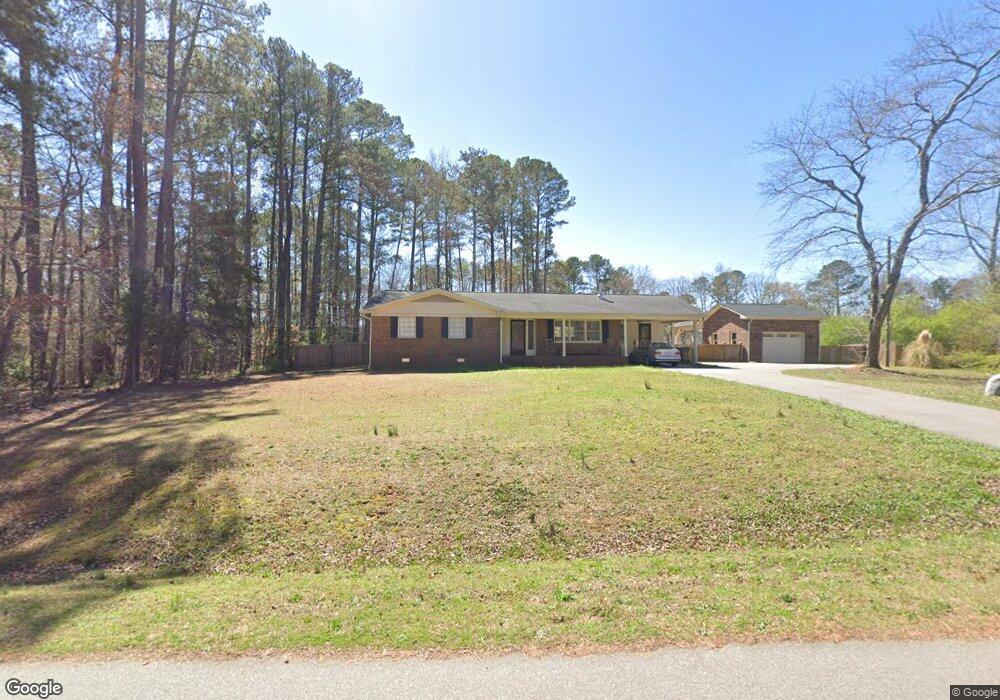
6809 Franklin Heights Rd Cary, NC 27518
Lochmere NeighborhoodEstimated Value: $449,000 - $496,000
3
Beds
2
Baths
1,529
Sq Ft
$309/Sq Ft
Est. Value
About This Home
This home is located at 6809 Franklin Heights Rd, Cary, NC 27518 and is currently estimated at $471,838, approximately $308 per square foot. 6809 Franklin Heights Rd is a home located in Wake County with nearby schools including Swift Creek Elementary School, Dillard Drive Magnet Middle School, and Thales Academy Cary Pre-K-6.
Ownership History
Date
Name
Owned For
Owner Type
Purchase Details
Closed on
Feb 11, 2016
Sold by
Rouse Zabulon W and Rouse Jessica
Bought by
Farag Michael and Farag Bethany
Current Estimated Value
Home Financials for this Owner
Home Financials are based on the most recent Mortgage that was taken out on this home.
Original Mortgage
$50,000
Outstanding Balance
$39,975
Interest Rate
4.04%
Mortgage Type
New Conventional
Estimated Equity
$431,863
Purchase Details
Closed on
Nov 15, 2011
Sold by
The Imber Family Limited Partnership #1
Bought by
Rouse Zebulon W
Home Financials for this Owner
Home Financials are based on the most recent Mortgage that was taken out on this home.
Original Mortgage
$165,592
Interest Rate
3.75%
Mortgage Type
FHA
Purchase Details
Closed on
Nov 24, 1998
Sold by
Imber Craig Francis and Imber Mary Lou
Bought by
The Imber Family Ltd Partnership #1
Create a Home Valuation Report for This Property
The Home Valuation Report is an in-depth analysis detailing your home's value as well as a comparison with similar homes in the area
Home Values in the Area
Average Home Value in this Area
Purchase History
| Date | Buyer | Sale Price | Title Company |
|---|---|---|---|
| Farag Michael | $202,000 | None Available | |
| Rouse Zebulon W | $170,000 | None Available | |
| The Imber Family Ltd Partnership #1 | -- | -- |
Source: Public Records
Mortgage History
| Date | Status | Borrower | Loan Amount |
|---|---|---|---|
| Open | Farag Michael | $50,000 | |
| Previous Owner | Rouse Zebulon W | $165,592 |
Source: Public Records
Tax History Compared to Growth
Tax History
| Year | Tax Paid | Tax Assessment Tax Assessment Total Assessment is a certain percentage of the fair market value that is determined by local assessors to be the total taxable value of land and additions on the property. | Land | Improvement |
|---|---|---|---|---|
| 2025 | -- | $474,771 | $230,000 | $244,771 |
| 2024 | $4,001 | $474,771 | $230,000 | $244,771 |
| 2023 | $2,512 | $248,722 | $86,000 | $162,722 |
| 2022 | $2,419 | $248,722 | $86,000 | $162,722 |
| 2021 | $2,089 | $218,890 | $86,000 | $132,890 |
| 2020 | $2,099 | $218,890 | $86,000 | $132,890 |
| 2019 | $1,898 | $175,384 | $76,000 | $99,384 |
| 2018 | $1,782 | $175,384 | $76,000 | $99,384 |
| 2017 | $1,712 | $175,384 | $76,000 | $99,384 |
| 2016 | $1,687 | $175,384 | $76,000 | $99,384 |
| 2015 | $1,543 | $154,679 | $70,000 | $84,679 |
| 2014 | $1,455 | $154,679 | $70,000 | $84,679 |
Source: Public Records
Map
Nearby Homes
- 406 Cricketfield Ln
- 105 Crosswaite Way
- 104 Jersey Ridge Rd
- 107 Tower Hamlet Dr
- 6315 Tryon Rd
- 210 Coltsgate Dr
- 202 Coltsgate Dr
- 102 Ravenstone Dr
- 131 Longbridge Dr
- 307 Durington Place
- 105 Headlands Ln
- 101 Turnberry Ln
- 0 SE Cary Pkwy Unit 2491180
- 647 Newlyn Dr
- 304 W Kirkfield Dr
- 2414 Stephens Rd
- 2434 Stephens Rd
- 219 Lochside Dr
- 8637 Macedonia Lake Dr
- 2015 Piney Plains Rd
- 6800 Franklin Heights Rd
- 6802 Franklin Heights Rd
- 6802 Franklin Heights Rd Unit 6800 Franklin Height
- 6813 Franklin Heights Rd
- 3008 Cowley Rd
- 6801 Franklin Heights Rd
- 2904 Cowley Rd
- 6804 Franklin Heights Rd
- 6816 Franklin Heights Rd
- 6812 Franklin Heights Rd
- 6820 Franklin Heights Rd
- 6800 Franklin Heights Lo21 Rd
- 2901 Piney Plains Rd
- 2905 Piney Plains Rd
- 2909 Cowley Rd
- 2909 Piney Plains Rd
- 2817 Piney Plains Rd
- 2905 Cowley Rd
- 2808 Cowley Rd
- 2913 Piney Plains Rd