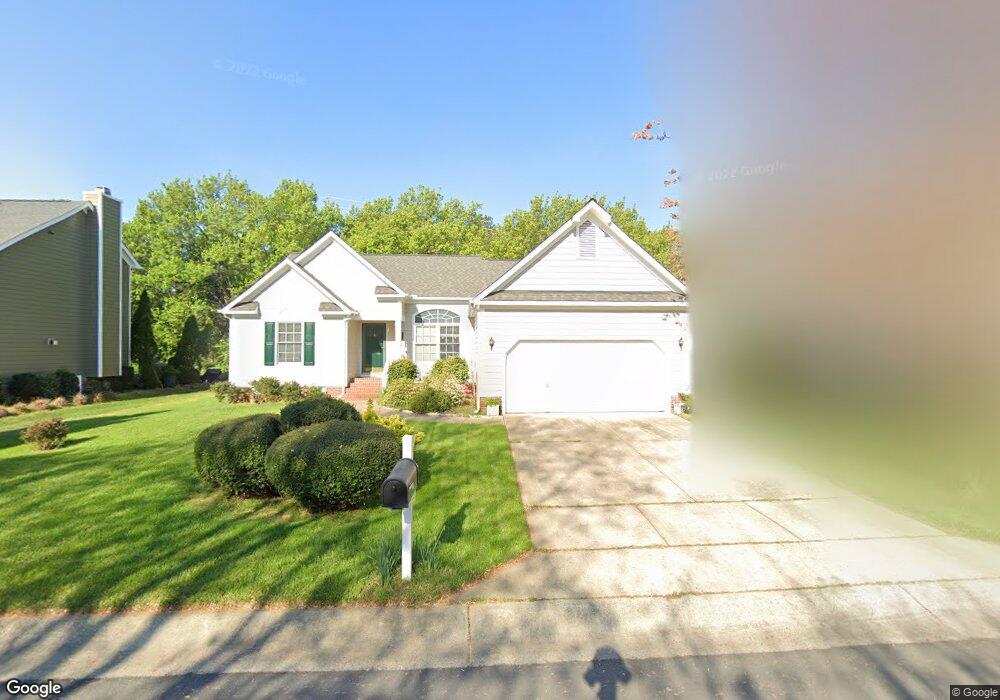
6809 Lynnoak Dr Raleigh, NC 27613
Estimated Value: $498,000 - $518,433
3
Beds
2
Baths
1,800
Sq Ft
$282/Sq Ft
Est. Value
About This Home
This home is located at 6809 Lynnoak Dr, Raleigh, NC 27613 and is currently estimated at $506,858, approximately $281 per square foot. 6809 Lynnoak Dr is a home located in Wake County with nearby schools including Lynn Road Elementary School, Carroll Middle, and Sanderson High School.
Ownership History
Date
Name
Owned For
Owner Type
Purchase Details
Closed on
Aug 12, 2014
Sold by
Bowling Shirley S
Bought by
Underwood Nancy L
Current Estimated Value
Home Financials for this Owner
Home Financials are based on the most recent Mortgage that was taken out on this home.
Original Mortgage
$210,600
Outstanding Balance
$160,882
Interest Rate
4.16%
Mortgage Type
New Conventional
Estimated Equity
$345,976
Purchase Details
Closed on
Dec 29, 2006
Sold by
Tremoulis Louis F and Tremoulis Karan M
Bought by
Bowling Shirley S
Home Financials for this Owner
Home Financials are based on the most recent Mortgage that was taken out on this home.
Original Mortgage
$60,000
Interest Rate
6.19%
Mortgage Type
Purchase Money Mortgage
Purchase Details
Closed on
Mar 31, 2003
Sold by
Lothian James E and Lothian Sharon
Bought by
Tremoulis Louis F and Tremoulis Karan M
Home Financials for this Owner
Home Financials are based on the most recent Mortgage that was taken out on this home.
Original Mortgage
$144,000
Interest Rate
5.19%
Create a Home Valuation Report for This Property
The Home Valuation Report is an in-depth analysis detailing your home's value as well as a comparison with similar homes in the area
Home Values in the Area
Average Home Value in this Area
Purchase History
| Date | Buyer | Sale Price | Title Company |
|---|---|---|---|
| Underwood Nancy L | $234,000 | None Available | |
| Bowling Shirley S | $210,000 | None Available | |
| Tremoulis Louis F | $180,000 | -- |
Source: Public Records
Mortgage History
| Date | Status | Borrower | Loan Amount |
|---|---|---|---|
| Open | Underwood Nancy L | $210,600 | |
| Previous Owner | Bowling Shirley S | $60,000 | |
| Previous Owner | Tremoulis Louis F | $144,000 |
Source: Public Records
Tax History Compared to Growth
Tax History
| Year | Tax Paid | Tax Assessment Tax Assessment Total Assessment is a certain percentage of the fair market value that is determined by local assessors to be the total taxable value of land and additions on the property. | Land | Improvement |
|---|---|---|---|---|
| 2025 | $4,172 | $476,068 | $180,000 | $296,068 |
| 2024 | $4,155 | $476,068 | $180,000 | $296,068 |
| 2023 | $3,716 | $339,115 | $112,500 | $226,615 |
| 2022 | $3,454 | $339,115 | $112,500 | $226,615 |
| 2021 | $3,320 | $339,115 | $112,500 | $226,615 |
| 2020 | $3,259 | $339,115 | $112,500 | $226,615 |
| 2019 | $3,053 | $261,688 | $81,000 | $180,688 |
| 2018 | $2,879 | $261,688 | $81,000 | $180,688 |
| 2017 | $2,742 | $261,688 | $81,000 | $180,688 |
| 2016 | $2,686 | $261,688 | $81,000 | $180,688 |
| 2015 | $2,468 | $236,382 | $81,000 | $155,382 |
| 2014 | -- | $236,382 | $81,000 | $155,382 |
Source: Public Records
Map
Nearby Homes
- 2428 Havershire Dr
- 8920 Taymouth Ct
- 2609 Cobworth Ct
- 2610 Sawmill Rd
- 6909 Woodmere Dr
- 6502 Brecken Pines Ct
- 7741 Wilderness Rd
- 7740 Wilderness Rd
- 6924 Three Bridges Cir
- 7922 Footman Way
- 7401 Ray Rd
- 6925 Valley Lake Dr
- 2204 Middlefield Ct
- 6505 Burnette Flower Way
- 6501 Burnette Flower Way
- 7601 Valview St
- 1701 Burnette Garden Path
- 1705 Burnette Garden Path
- 6304 Ansley Ln
- 6801 Valley Lake Dr
- 6813 Lynnoak Dr
- 6805 Lynnoak Dr
- 6901 Lynnoak Dr
- 6801 Lynnoak Dr
- 2345 Millstaff Ct
- 2344 Kendricks Ct
- 2405 Tusket Ct
- 6905 Lynnoak Dr
- 6900 Lynnoak Dr
- 2341 Millstaff Ct
- 8608 Keegan Ct
- 2401 Tusket Ct
- 2340 Kendricks Ct
- 8604 Keegan Ct
- 2340 Millstaff Ct
- 6909 Lynnoak Dr
- 2337 Millstaff Ct
- 2349 Kendricks Ct
- 2345 Kendricks Ct
- 6908 Lynnoak Dr