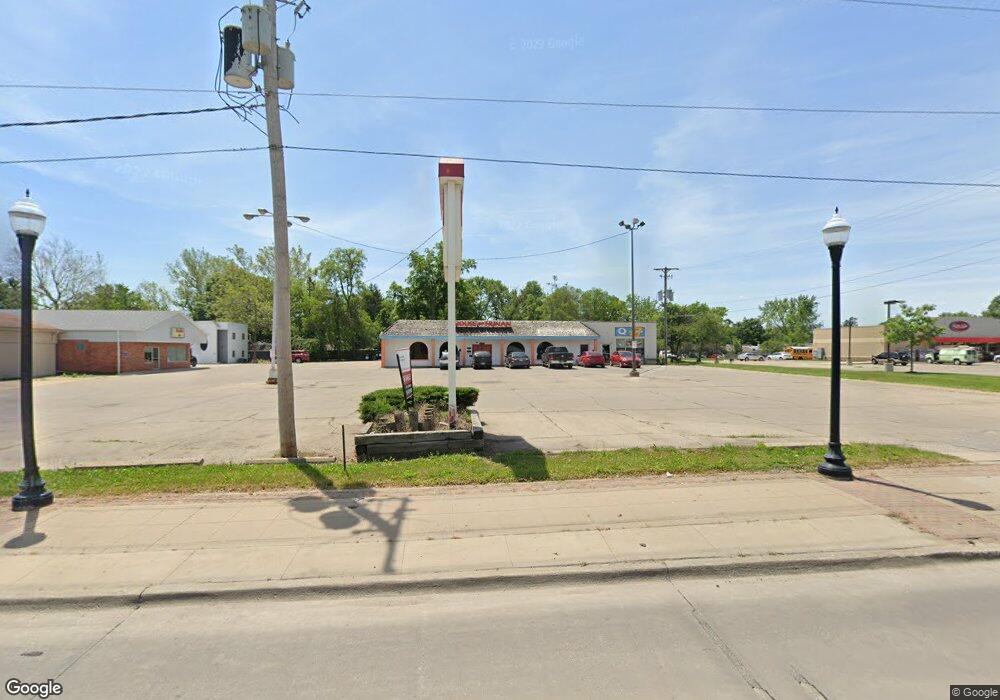
6810 Douglas Ave Urbandale, IA 50322
Estimated Value: $718,726
--
Bed
1
Bath
10,645
Sq Ft
$68/Sq Ft
Est. Value
About This Home
This home is located at 6810 Douglas Ave, Urbandale, IA 50322 and is currently estimated at $718,726, approximately $67 per square foot. 6810 Douglas Ave is a home located in Polk County with nearby schools including Valerius Elementary School, Urbandale Middle School, and Urbandale High School.
Ownership History
Date
Name
Owned For
Owner Type
Purchase Details
Closed on
Nov 22, 2021
Sold by
Wang Hui and Yang Fang
Bought by
Church Zotung Emmanuel Baptist
Current Estimated Value
Home Financials for this Owner
Home Financials are based on the most recent Mortgage that was taken out on this home.
Original Mortgage
$340,000
Outstanding Balance
$312,196
Interest Rate
3.14%
Mortgage Type
Commercial
Estimated Equity
$406,530
Purchase Details
Closed on
Nov 30, 2017
Sold by
Mo Shang Yu and Mo Michelle
Bought by
Wang Hui
Home Financials for this Owner
Home Financials are based on the most recent Mortgage that was taken out on this home.
Original Mortgage
$356,000
Interest Rate
3.9%
Mortgage Type
Future Advance Clause Open End Mortgage
Purchase Details
Closed on
Dec 8, 2010
Sold by
Fleming Charles T and Fleming Judy A
Bought by
Mo Shang Yu and Mo Michelle
Purchase Details
Closed on
Jul 12, 2000
Sold by
Fleming Charles T and Fleming Judy A
Bought by
Fleming Charles T and Fleming Judy A
Create a Home Valuation Report for This Property
The Home Valuation Report is an in-depth analysis detailing your home's value as well as a comparison with similar homes in the area
Home Values in the Area
Average Home Value in this Area
Purchase History
| Date | Buyer | Sale Price | Title Company |
|---|---|---|---|
| Church Zotung Emmanuel Baptist | $594,000 | None Available | |
| Wang Hui | $445,000 | None Available | |
| Mo Shang Yu | $299,500 | None Available | |
| Fleming Charles T | -- | -- |
Source: Public Records
Mortgage History
| Date | Status | Borrower | Loan Amount |
|---|---|---|---|
| Open | Church Zotung Emmanuel Baptist | $340,000 | |
| Previous Owner | Wang Hui | $356,000 |
Source: Public Records
Tax History Compared to Growth
Tax History
| Year | Tax Paid | Tax Assessment Tax Assessment Total Assessment is a certain percentage of the fair market value that is determined by local assessors to be the total taxable value of land and additions on the property. | Land | Improvement |
|---|---|---|---|---|
| 2025 | $12,162 | $646,000 | $578,000 | $68,000 |
| 2024 | $12,162 | $567,000 | $507,000 | $60,000 |
| 2023 | $12,162 | $567,000 | $507,000 | $60,000 |
| 2022 | $12,162 | $426,000 | $424,000 | $2,000 |
| 2021 | $18,672 | $426,000 | $424,000 | $2,000 |
| 2020 | $18,904 | $609,000 | $386,000 | $223,000 |
| 2019 | $17,472 | $609,000 | $386,000 | $223,000 |
| 2018 | $17,272 | $570,000 | $385,500 | $184,500 |
| 2017 | $15,344 | $570,000 | $385,500 | $184,500 |
| 2016 | $15,298 | $525,000 | $321,000 | $204,000 |
| 2015 | $15,298 | $525,000 | $321,000 | $204,000 |
| 2014 | $15,210 | $492,000 | $321,000 | $171,000 |
Source: Public Records
Map
Nearby Homes
- 6908 Maryland Dr Unit 6908
- 3814 67th St
- 3814 66th St
- 3818 66th St
- 6717 Roseland Dr
- 7105 Madison Ave
- 3626 64th St
- 3233 68th St
- 7204 Douglas Ave
- 3808 72nd St
- 4006 66th St
- 4017 68th St
- 3929 64th St
- 7307 Douglas Ave
- 4105 65th St
- 7314 Roseland Dr
- 7051 Oak Brook Dr
- 7017 Winston Ave
- 7201 Maple Dr
- 3320 61st St
- 3682 68th St Unit 9
- 6808 Douglas Ave
- 3640 68th St
- 3650 68th St
- 6800 Douglas Ave
- 3612 68th St
- 6813 Douglas Ave
- 6833 1/2 Douglas Ave
- 3617 68th St
- 6851 Oliver Smith Dr
- 3619 70th St
- 3615 68th St
- 6855 Oliver Smith Dr
- 3627 70th St
- 3602 68th St
- 3613 68th St
- 3804 68th St
- 3806 69th St
- 3819 69th St
- 3611 68th St