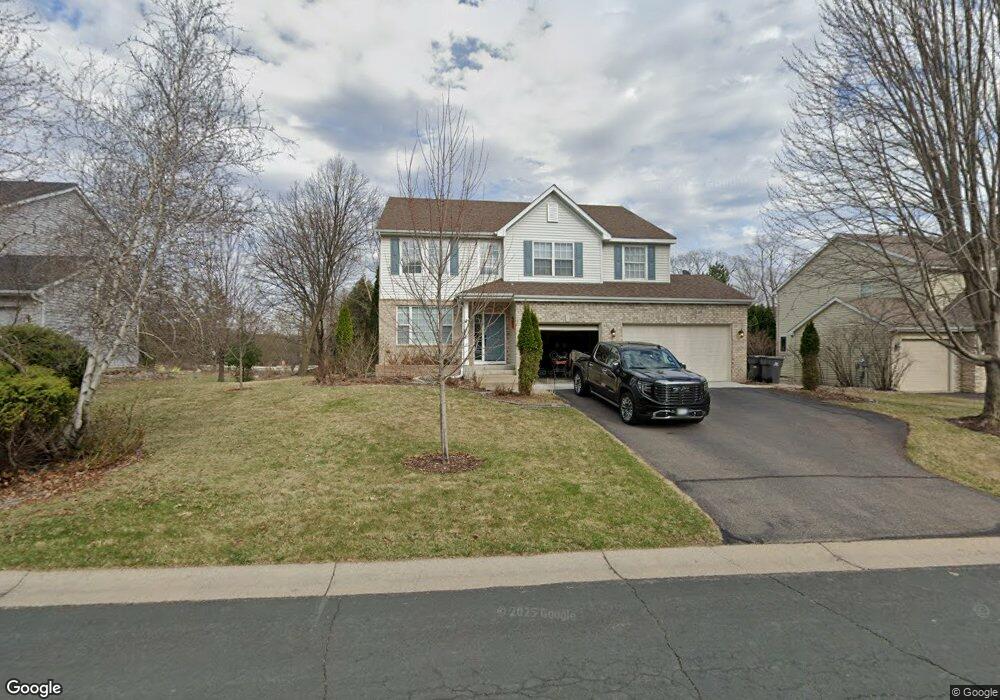
6811 Briarwood Ct Chanhassen, MN 55317
Estimated Value: $680,000 - $779,000
4
Beds
3
Baths
2,731
Sq Ft
$265/Sq Ft
Est. Value
About This Home
This home is located at 6811 Briarwood Ct, Chanhassen, MN 55317 and is currently estimated at $723,700, approximately $264 per square foot. 6811 Briarwood Ct is a home located in Carver County with nearby schools including Excelsior Elementary School, Minnetonka West Middle School, and Minnetonka Senior High School.
Ownership History
Date
Name
Owned For
Owner Type
Purchase Details
Closed on
Feb 18, 2020
Sold by
Tatum Jerome W and Tatum Jennifer L
Bought by
Twiggs Thane T and Twiggs Linda J
Current Estimated Value
Home Financials for this Owner
Home Financials are based on the most recent Mortgage that was taken out on this home.
Original Mortgage
$343,000
Outstanding Balance
$236,322
Interest Rate
3.6%
Mortgage Type
New Conventional
Estimated Equity
$487,378
Purchase Details
Closed on
Aug 8, 2005
Sold by
Voehl Timothy A and Voehl Teresa M
Bought by
Tatum Jerome W and Tatum Jennifer L
Home Financials for this Owner
Home Financials are based on the most recent Mortgage that was taken out on this home.
Original Mortgage
$388,000
Interest Rate
5.41%
Mortgage Type
Adjustable Rate Mortgage/ARM
Purchase Details
Closed on
Feb 25, 2000
Sold by
Centex Homes Minnesota Division
Bought by
Voehl Timothy A and Voehl Teresa M
Create a Home Valuation Report for This Property
The Home Valuation Report is an in-depth analysis detailing your home's value as well as a comparison with similar homes in the area
Home Values in the Area
Average Home Value in this Area
Purchase History
| Date | Buyer | Sale Price | Title Company |
|---|---|---|---|
| Twiggs Thane T | $490,000 | Weichert Natl Ttl Svcs Llc | |
| Tatum Jerome W | $485,000 | -- | |
| Voehl Timothy A | $274,985 | -- |
Source: Public Records
Mortgage History
| Date | Status | Borrower | Loan Amount |
|---|---|---|---|
| Open | Twiggs Thane T | $343,000 | |
| Previous Owner | Tatum Jerome W | $388,000 |
Source: Public Records
Tax History Compared to Growth
Tax History
| Year | Tax Paid | Tax Assessment Tax Assessment Total Assessment is a certain percentage of the fair market value that is determined by local assessors to be the total taxable value of land and additions on the property. | Land | Improvement |
|---|---|---|---|---|
| 2025 | $6,352 | $621,700 | $150,000 | $471,700 |
| 2024 | $6,202 | $580,000 | $138,800 | $441,200 |
| 2023 | $5,808 | $581,900 | $138,800 | $443,100 |
| 2022 | $5,738 | $551,800 | $127,800 | $424,000 |
| 2021 | $5,508 | $471,000 | $106,500 | $364,500 |
| 2020 | $5,664 | $474,900 | $106,500 | $368,400 |
| 2019 | $5,450 | $450,200 | $101,400 | $348,800 |
| 2018 | $5,386 | $450,200 | $101,400 | $348,800 |
| 2017 | $5,160 | $441,600 | $101,400 | $340,200 |
| 2016 | $5,274 | $424,000 | $0 | $0 |
| 2015 | $5,342 | $424,000 | $0 | $0 |
| 2014 | $5,342 | $402,100 | $0 | $0 |
Source: Public Records
Map
Nearby Homes
- 2150 Crestview Dr
- 7053 Pearl Dr
- 2125 Longacres Dr
- 2165 Longacres Dr
- 1770 Pheasant Cir
- 7266 Fawn Hill Rd
- 6480 Yosemite
- 6456 Yosemite Ln
- 6140 Chaska Rd
- 6155 Murray Ct
- 2408 Hunter Dr
- 2174 Majestic Way
- 7423 Fawn Hill Rd
- 7460 Windmill Dr
- 6040 Oakview Ct
- 1350 Heather Ct
- 6687 Mulberry Cir E
- 6430 Bretton Way
- 6491 Bretton Way
- 5910 Minnetonka Dr
- 6829 Briarwood Ct
- 6791 Briarwood Ct
- 6804 Briarwood Ct
- 6837 Briarwood Ct
- 6786 Briarwood Ct
- 6820 Briarwood Ct
- 6845 Briarwood Ct
- 6836 Briarwood Ct
- 6852 Briarwood Ct
- 6810 Diamond Ct
- 6787 Manchester Dr
- 6751 Manchester Dr
- 6800 Diamond Ct
- 6820 Diamond Ct
- 2051 Highgate Cir
- 6801 Manchester Dr
- 6805 Ruby Ln
- 6817 Manchester Dr
- 6739 Manchester Dr
- 2021 Highgate Cir