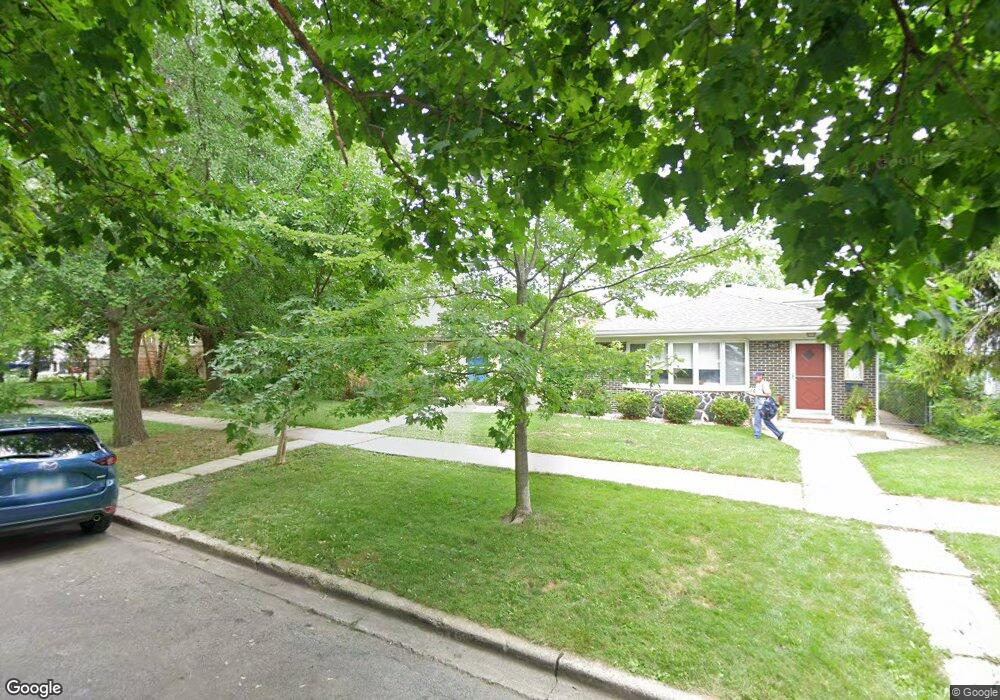
6811 N Oleander Ave Chicago, IL 60631
Edison Park NeighborhoodEstimated Value: $495,766 - $627,000
3
Beds
1
Bath
1,420
Sq Ft
$381/Sq Ft
Est. Value
About This Home
This home is located at 6811 N Oleander Ave, Chicago, IL 60631 and is currently estimated at $540,922, approximately $380 per square foot. 6811 N Oleander Ave is a home located in Cook County with nearby schools including Ebinger Elementary School, Taft High School, and St. Juliana School.
Ownership History
Date
Name
Owned For
Owner Type
Purchase Details
Closed on
Dec 31, 2014
Sold by
Kowalski James Gc
Bought by
Kowalski Kathleen M and Perry Thomas
Current Estimated Value
Home Financials for this Owner
Home Financials are based on the most recent Mortgage that was taken out on this home.
Original Mortgage
$127,285
Interest Rate
3.75%
Mortgage Type
New Conventional
Purchase Details
Closed on
Aug 15, 2011
Sold by
Kowalski James G C
Bought by
Kowalski Kathleen M and Perry Thomas
Purchase Details
Closed on
Jun 20, 2011
Sold by
Kowalski James George C
Bought by
Kowalski James G C and James G C Kowalski Trust
Purchase Details
Closed on
Oct 13, 1998
Sold by
Kowalski George C and Kowalski Frances
Bought by
De George C and De Mary Kowalski Self De
Create a Home Valuation Report for This Property
The Home Valuation Report is an in-depth analysis detailing your home's value as well as a comparison with similar homes in the area
Home Values in the Area
Average Home Value in this Area
Purchase History
| Date | Buyer | Sale Price | Title Company |
|---|---|---|---|
| Kowalski Kathleen M | $155,000 | Attorneys Title Guaranty Fun | |
| Kowalski Kathleen M | $155,000 | None Available | |
| Kowalski James G C | -- | None Available | |
| De George C | -- | -- |
Source: Public Records
Mortgage History
| Date | Status | Borrower | Loan Amount |
|---|---|---|---|
| Previous Owner | Kowalski Kathleen M | $127,285 |
Source: Public Records
Tax History Compared to Growth
Tax History
| Year | Tax Paid | Tax Assessment Tax Assessment Total Assessment is a certain percentage of the fair market value that is determined by local assessors to be the total taxable value of land and additions on the property. | Land | Improvement |
|---|---|---|---|---|
| 2024 | $7,140 | $41,675 | $12,678 | $28,997 |
| 2023 | $6,938 | $37,155 | $10,142 | $27,013 |
| 2022 | $6,938 | $37,155 | $10,142 | $27,013 |
| 2021 | $6,802 | $37,154 | $10,142 | $27,012 |
| 2020 | $7,232 | $35,568 | $6,845 | $28,723 |
| 2019 | $7,251 | $39,520 | $6,845 | $32,675 |
| 2018 | $8,026 | $44,069 | $6,845 | $37,224 |
| 2017 | $6,076 | $31,599 | $6,085 | $25,514 |
| 2016 | $5,829 | $31,599 | $6,085 | $25,514 |
| 2015 | $5,538 | $32,844 | $6,085 | $26,759 |
| 2014 | $5,141 | $30,276 | $5,071 | $25,205 |
| 2013 | $5,135 | $30,864 | $5,071 | $25,793 |
Source: Public Records
Map
Nearby Homes
- 6681 N Northwest Hwy
- 6727 N Oketo Ave
- 6919 N Overhill Ave
- 6625 N Northwest Hwy Unit 202
- 7005 N Osceola Ave
- 6841 N Northwest Hwy Unit 3C
- 6815 N Olmsted Ave Unit 203
- 7039 N Ottawa Ave
- 6852 N Northwest Hwy Unit 2B
- 6858 N Northwest Hwy Unit 2E
- 7315 W Lunt Ave
- 7324 W Lunt Ave
- 7101 N Ottawa Ave
- 7215 W Farwell Ave
- 460 S Northwest Hwy Unit 307A
- 400 S Northwest Hwy Unit 312B
- 6524 N Northwest Hwy Unit A
- 6500 N Northwest Hwy
- 7215 N Olcott Ave
- 6490 N Northwest Hwy Unit 3F
- 6815 N Oleander Ave
- 6821 N Oleander Ave
- 6821 N Oleander Ave
- 6803 N Oleander Ave
- 6829 N Oleander Ave
- 6806 N Olcott Ave
- 6810 N Olcott Ave
- 6804 N Olcott Ave
- 6816 N Olcott Ave
- 6831 N Oleander Ave
- 6800 N Olcott Ave
- 6822 N Olcott Ave
- 6833 N Oleander Ave
- 6810 N Oleander Ave
- 6808 N Oleander Ave
- 6818 N Oleander Ave
- 6804 N Oleander Ave
- 6826 N Olcott Ave
- 6800 N Oleander Ave
- 6837 N Oleander Ave