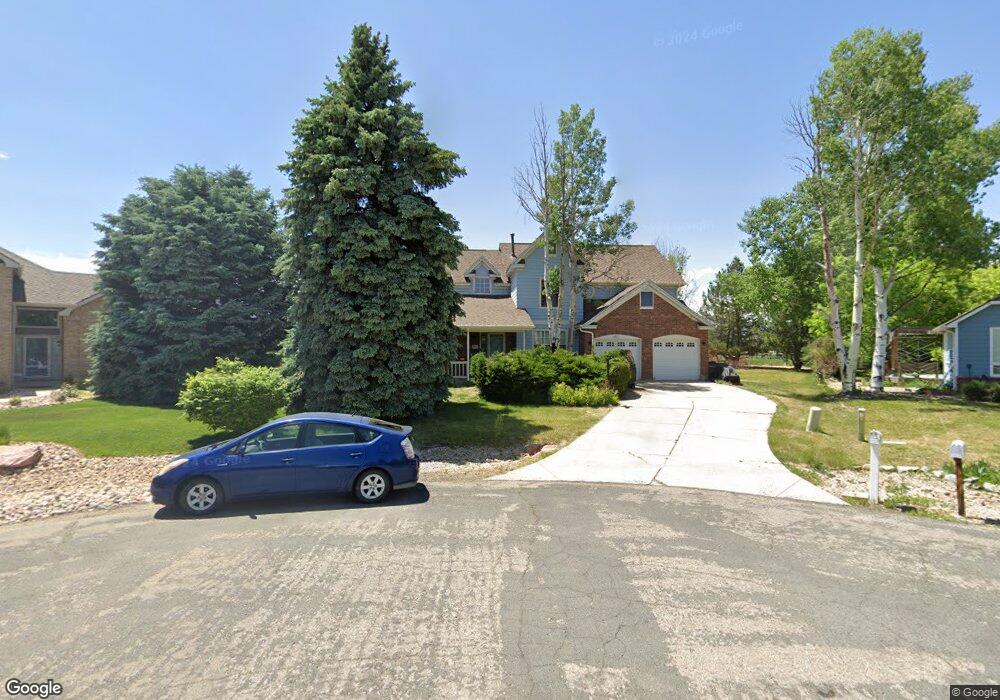
6811 Peppertree Dr Niwot, CO 80503
Niwot NeighborhoodEstimated Value: $1,230,064 - $1,432,000
5
Beds
3
Baths
2,674
Sq Ft
$492/Sq Ft
Est. Value
About This Home
This home is located at 6811 Peppertree Dr, Niwot, CO 80503 and is currently estimated at $1,316,266, approximately $492 per square foot. 6811 Peppertree Dr is a home located in Boulder County with nearby schools including Niwot Elementary School, Sunset Middle School, and Niwot High School.
Ownership History
Date
Name
Owned For
Owner Type
Purchase Details
Closed on
Aug 18, 2003
Sold by
Smith Scott W and Smith Jayne E
Bought by
Stadtherr Robert P
Current Estimated Value
Home Financials for this Owner
Home Financials are based on the most recent Mortgage that was taken out on this home.
Original Mortgage
$250,000
Outstanding Balance
$109,208
Interest Rate
5.51%
Mortgage Type
Purchase Money Mortgage
Estimated Equity
$1,207,058
Purchase Details
Closed on
Jan 3, 1996
Sold by
Sheffield Martha L
Bought by
Smith Scott W
Home Financials for this Owner
Home Financials are based on the most recent Mortgage that was taken out on this home.
Original Mortgage
$203,000
Interest Rate
7.31%
Purchase Details
Closed on
Sep 7, 1993
Sold by
Sheffield Arthur L and Sheffield Martha L
Bought by
Sheffield Martha L
Purchase Details
Closed on
Mar 12, 1991
Bought by
Stadtherr Robert P and Stadtherr Diane M
Purchase Details
Closed on
Jul 17, 1990
Bought by
Stadtherr Robert P and Stadtherr Diane M
Create a Home Valuation Report for This Property
The Home Valuation Report is an in-depth analysis detailing your home's value as well as a comparison with similar homes in the area
Home Values in the Area
Average Home Value in this Area
Purchase History
| Date | Buyer | Sale Price | Title Company |
|---|---|---|---|
| Stadtherr Robert P | $450,000 | Commonwealth Title | |
| Smith Scott W | $267,000 | -- | |
| Sheffield Martha L | -- | -- | |
| Stadtherr Robert P | $222,100 | -- | |
| Stadtherr Robert P | $44,500 | -- |
Source: Public Records
Mortgage History
| Date | Status | Borrower | Loan Amount |
|---|---|---|---|
| Open | Stadtherr Robert P | $250,000 | |
| Previous Owner | Smith Scott W | $203,000 | |
| Closed | Stadtherr Robert P | $80,000 |
Source: Public Records
Tax History Compared to Growth
Tax History
| Year | Tax Paid | Tax Assessment Tax Assessment Total Assessment is a certain percentage of the fair market value that is determined by local assessors to be the total taxable value of land and additions on the property. | Land | Improvement |
|---|---|---|---|---|
| 2025 | $7,820 | $71,931 | $27,706 | $44,225 |
| 2024 | $7,820 | $71,931 | $27,706 | $44,225 |
| 2023 | $7,717 | $79,067 | $26,760 | $55,992 |
| 2022 | $5,960 | $58,234 | $23,227 | $35,007 |
| 2021 | $6,040 | $59,910 | $23,895 | $36,015 |
| 2020 | $5,169 | $51,373 | $15,587 | $35,786 |
| 2019 | $5,087 | $51,373 | $15,587 | $35,786 |
| 2018 | $4,288 | $43,531 | $12,456 | $31,075 |
| 2017 | $4,036 | $48,126 | $13,771 | $34,355 |
| 2016 | $4,008 | $42,348 | $12,418 | $29,930 |
| 2015 | $3,818 | $37,588 | $7,642 | $29,946 |
| 2014 | $3,792 | $37,588 | $7,642 | $29,946 |
Source: Public Records
Map
Nearby Homes
- 7464 Whirlaway Ln
- 8050 Niwot Rd Unit 1
- 8050 Niwot Rd Unit 28
- 8050 Niwot Rd Unit 40
- 8060 Niwot Rd Unit 66E
- 8060 Niwot Rd Unit 34
- 8076 Meadowdale Square
- 8180 Dry Creek Cir
- 7284 Dry Creek Rd
- 6789 Niwot Rd
- 8400 Sawtooth Ln
- 3625 Nimbus Rd
- 8461 Pawnee Ln
- 7466 Park Lane Rd
- 8748 Skyland Dr
- 5580 Colt Dr
- 7204 Spring Creek Cir
- 8020 N 81st St
- 8896 Niwot Rd
- 6541 Legend Ridge Trail
- 6802 Peppertree Dr
- 6823 Peppertree Dr
- 6828 Peppertree Dr
- 6835 Peppertree Dr
- 6957 Peppertree Dr
- 6844 Peppertree Dr
- 6847 Peppertree Dr
- 6852 Peppertree Dr
- 6855 Peppertree Dr
- 6860 Peppertree Dr
- 6861 Peppertree Dr
- 6889 Peppertree Ln
- 6864 Peppertree Ct
- 7597 Estate Cir
- 6897 Peppertree Ln
- 6883 Peppertree Ln
- 7601 Estate Cir
- 7583 Estate Cir
- 7575 Estate Cir
- 7615 Estate Cir