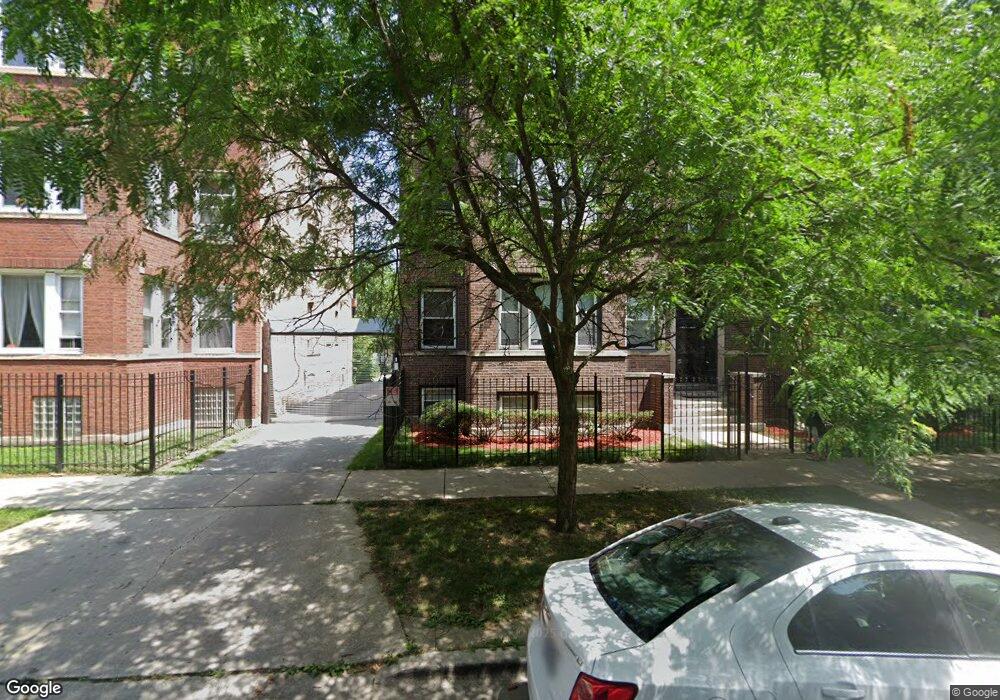
6811 S Cornell Ave Unit 2S Chicago, IL 60649
South Shore NeighborhoodEstimated Value: $159,390 - $258,000
3
Beds
2
Baths
1,073
Sq Ft
$190/Sq Ft
Est. Value
About This Home
This home is located at 6811 S Cornell Ave Unit 2S, Chicago, IL 60649 and is currently estimated at $203,348, approximately $189 per square foot. 6811 S Cornell Ave Unit 2S is a home located in Cook County with nearby schools including Parkside Elementary Community Academy, Hyde Park Academy High School, and Muhammad University.
Ownership History
Date
Name
Owned For
Owner Type
Purchase Details
Closed on
May 2, 2016
Sold by
G & J Maint Corp
Bought by
Ashford Hershella
Current Estimated Value
Home Financials for this Owner
Home Financials are based on the most recent Mortgage that was taken out on this home.
Original Mortgage
$88,000
Interest Rate
4.75%
Mortgage Type
New Conventional
Purchase Details
Closed on
Dec 3, 2014
Sold by
Green Tree Servicing Llc and Fannie Mae
Bought by
Federal Natl Mtg Assn
Purchase Details
Closed on
Sep 11, 2007
Sold by
6811 S Cornell Llc
Bought by
Enck Kimberly
Home Financials for this Owner
Home Financials are based on the most recent Mortgage that was taken out on this home.
Original Mortgage
$194,900
Interest Rate
6.63%
Mortgage Type
New Conventional
Create a Home Valuation Report for This Property
The Home Valuation Report is an in-depth analysis detailing your home's value as well as a comparison with similar homes in the area
Home Values in the Area
Average Home Value in this Area
Purchase History
| Date | Buyer | Sale Price | Title Company |
|---|---|---|---|
| Ashford Hershella | $110,000 | None Available | |
| Federal Natl Mtg Assn | -- | -- | |
| G & J Bid Maint Corp | -- | -- | |
| Federal Natl Mtg Assn | -- | -- | |
| Green Tree Servicing Llc | -- | -- | |
| Enck Kimberly | $202,000 | Chicago Title Insurance Co |
Source: Public Records
Mortgage History
| Date | Status | Borrower | Loan Amount |
|---|---|---|---|
| Previous Owner | Ashford Hershella | $88,000 | |
| Previous Owner | Enck Kimberly | $194,900 |
Source: Public Records
Tax History
| Year | Tax Paid | Tax Assessment Tax Assessment Total Assessment is a certain percentage of the fair market value that is determined by local assessors to be the total taxable value of land and additions on the property. | Land | Improvement |
|---|---|---|---|---|
| 2025 | $2,329 | $14,059 | $2,701 | $11,358 |
| 2024 | $2,329 | $14,059 | $2,701 | $11,358 |
| 2023 | $2,262 | $11,000 | $2,170 | $8,830 |
| 2022 | $2,262 | $11,000 | $2,170 | $8,830 |
| 2021 | $2,212 | $10,999 | $2,170 | $8,829 |
| 2020 | $2,134 | $9,578 | $1,302 | $8,276 |
| 2019 | $2,109 | $10,496 | $1,302 | $9,194 |
| 2018 | $2,073 | $10,496 | $1,302 | $9,194 |
| 2017 | $1,315 | $6,110 | $1,157 | $4,953 |
| 2016 | $1,224 | $6,110 | $1,157 | $4,953 |
| 2015 | $1,120 | $6,110 | $1,157 | $4,953 |
| 2014 | $1,195 | $9,008 | $1,012 | $7,996 |
| 2013 | $1,160 | $9,008 | $1,012 | $7,996 |
Source: Public Records
Map
Nearby Homes
- 6823 S Ridgeland Ave
- 6722 S Ridgeland Ave Unit 3S
- 6934 S Cornell Ave
- 1729 E 67th St Unit 2E
- 1511 E 67th Place
- 1464 E 69th St Unit 2N
- 6731 S Cregier Ave
- 7821 S Stony Island Ave
- 7006 S East End Ave
- 6800 S Dante Ave Unit P13
- 6800 S Dante Ave Unit P14
- 6800 S Dante Ave Unit P15
- 7018 S Stony Island Ave
- 7006 S Cregier Ave
- 7027 S Harper Ave
- 1443 E 66th Place
- 1439 E 66th Place
- 6834 S Dorchester Ave
- 1453 E 65th Place
- 1500 E Marquette Rd
- 6811 S Cornell Ave Unit GN
- 6811 S Cornell Ave
- 6811 S Cornell Ave Unit 1S
- 6811 S Cornell Ave Unit BN
- 6811 S Cornell Ave Unit 3S
- 6811 S Cornell Ave Unit BS
- 6811 S Cornell Ave Unit 3N
- 6811 S Cornell Ave Unit 2N
- 6811 S Cornell Ave Unit 1N
- 6811 S Cornell Ave Unit G
- 6811 S Cornell Ave Unit GS
- 6811 S Cornell Ave Unit 1
- 6811 S Cornell Ave Unit S3
- 6813 S Cornell Ave Unit 1S
- 6813 S Cornell Ave Unit 3S
- 6813 S Cornell Ave
- 6813 S Cornell Ave Unit 2S
- 6813 S Cornell Ave Unit S3
- 6819 S Cornell Ave Unit 1
- 6809 S Cornell Ave Unit 3
Your Personal Tour Guide
Ask me questions while you tour the home.