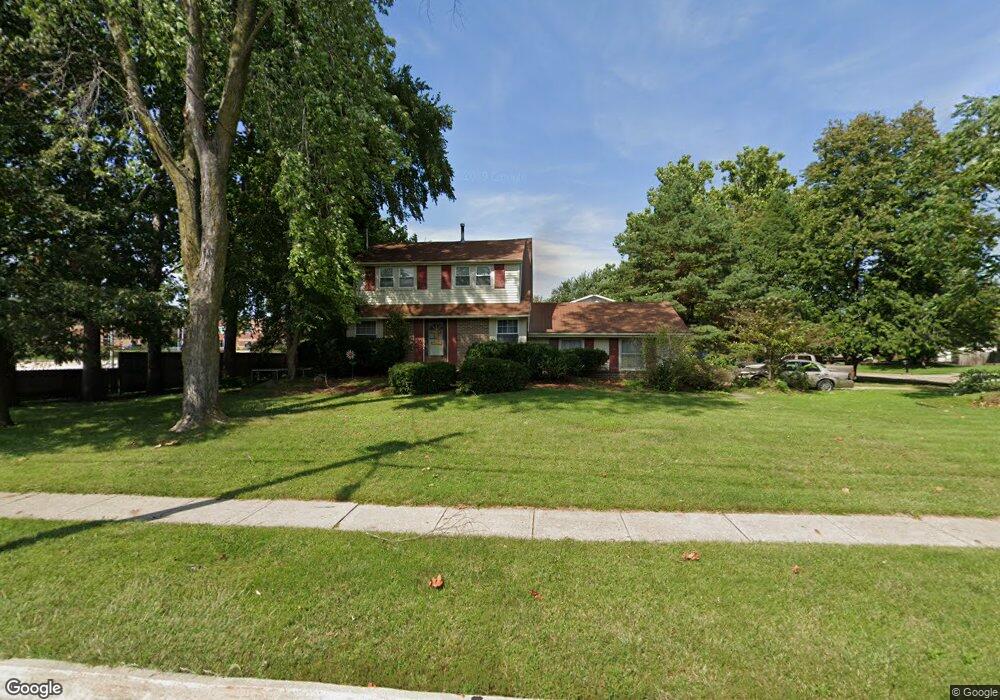
6811 Townsend Ave Urbandale, IA 50322
Estimated Value: $232,000 - $261,639
2
Beds
2
Baths
910
Sq Ft
$269/Sq Ft
Est. Value
About This Home
This home is located at 6811 Townsend Ave, Urbandale, IA 50322 and is currently estimated at $244,660, approximately $268 per square foot. 6811 Townsend Ave is a home located in Polk County with nearby schools including Urbandale Middle School, Urbandale High School, and St Pius X School.
Ownership History
Date
Name
Owned For
Owner Type
Purchase Details
Closed on
Oct 23, 2001
Sold by
Hyslope Darlene Ann
Bought by
Graalfs Michael D and Graalfs Lisa C
Current Estimated Value
Home Financials for this Owner
Home Financials are based on the most recent Mortgage that was taken out on this home.
Original Mortgage
$108,145
Outstanding Balance
$42,301
Interest Rate
6.88%
Mortgage Type
FHA
Estimated Equity
$202,359
Purchase Details
Closed on
May 27, 1997
Sold by
Welch Eric G and Welch Marilyn J
Bought by
Hyslope Darlene
Create a Home Valuation Report for This Property
The Home Valuation Report is an in-depth analysis detailing your home's value as well as a comparison with similar homes in the area
Home Values in the Area
Average Home Value in this Area
Purchase History
| Date | Buyer | Sale Price | Title Company |
|---|---|---|---|
| Graalfs Michael D | $108,500 | -- | |
| Hyslope Darlene | $87,000 | -- |
Source: Public Records
Mortgage History
| Date | Status | Borrower | Loan Amount |
|---|---|---|---|
| Open | Graalfs Michael D | $108,145 |
Source: Public Records
Tax History Compared to Growth
Tax History
| Year | Tax Paid | Tax Assessment Tax Assessment Total Assessment is a certain percentage of the fair market value that is determined by local assessors to be the total taxable value of land and additions on the property. | Land | Improvement |
|---|---|---|---|---|
| 2025 | $4,208 | $244,600 | $71,400 | $173,200 |
| 2024 | $4,208 | $232,300 | $66,800 | $165,500 |
| 2023 | $3,982 | $232,300 | $66,800 | $165,500 |
| 2022 | $3,936 | $185,600 | $54,500 | $131,100 |
| 2021 | $3,810 | $185,600 | $54,500 | $131,100 |
| 2020 | $3,746 | $170,500 | $50,100 | $120,400 |
| 2019 | $3,572 | $170,500 | $50,100 | $120,400 |
| 2018 | $3,442 | $155,300 | $44,700 | $110,600 |
| 2017 | $3,206 | $155,300 | $44,700 | $110,600 |
| 2016 | $3,128 | $142,200 | $40,500 | $101,700 |
| 2015 | $3,128 | $142,200 | $40,500 | $101,700 |
| 2014 | $3,517 | $137,700 | $38,500 | $99,200 |
Source: Public Records
Map
Nearby Homes