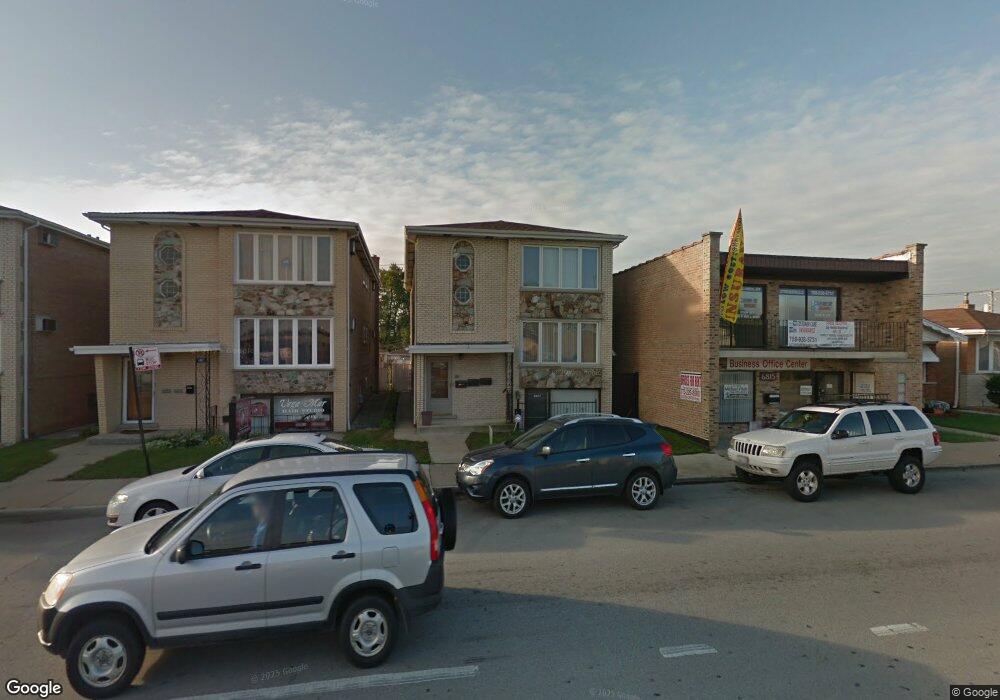
6811 W 63rd St Chicago, IL 60638
Clearing NeighborhoodEstimated Value: $424,000 - $494,889
6
Beds
3
Baths
1,250
Sq Ft
$377/Sq Ft
Est. Value
About This Home
This home is located at 6811 W 63rd St, Chicago, IL 60638 and is currently estimated at $470,972, approximately $376 per square foot. 6811 W 63rd St is a home located in Cook County with nearby schools including Dore Elementary School and Kennedy High School.
Ownership History
Date
Name
Owned For
Owner Type
Purchase Details
Closed on
Aug 30, 2024
Sold by
Dominguez Gilberto J and Castillo Laura A
Bought by
Aceves Roberto and Aceves Maria Guadalupe
Current Estimated Value
Home Financials for this Owner
Home Financials are based on the most recent Mortgage that was taken out on this home.
Original Mortgage
$250,000
Outstanding Balance
$225,591
Interest Rate
6.78%
Mortgage Type
Credit Line Revolving
Estimated Equity
$245,381
Purchase Details
Closed on
Aug 31, 2017
Sold by
Highlander Rock Inc
Bought by
Dominguez Gilberto J and Castillo Laura A
Home Financials for this Owner
Home Financials are based on the most recent Mortgage that was taken out on this home.
Original Mortgage
$279,000
Interest Rate
4.5%
Mortgage Type
New Conventional
Purchase Details
Closed on
Dec 14, 2016
Sold by
Soldat Carol
Bought by
Highlander Rock Inc
Purchase Details
Closed on
Jul 31, 2013
Sold by
Soldat Teresa
Bought by
Soldat Teresa and The Soldat Trust
Create a Home Valuation Report for This Property
The Home Valuation Report is an in-depth analysis detailing your home's value as well as a comparison with similar homes in the area
Home Values in the Area
Average Home Value in this Area
Purchase History
| Date | Buyer | Sale Price | Title Company |
|---|---|---|---|
| Aceves Roberto | $515,000 | First American Title | |
| Dominguez Gilberto J | $372,000 | Attorney | |
| Highlander Rock Inc | $340,000 | Fidelity National Title | |
| Soldat Teresa | -- | None Available |
Source: Public Records
Mortgage History
| Date | Status | Borrower | Loan Amount |
|---|---|---|---|
| Open | Aceves Roberto | $250,000 | |
| Previous Owner | Dominguez Gilberto J | $279,000 |
Source: Public Records
Tax History
| Year | Tax Paid | Tax Assessment Tax Assessment Total Assessment is a certain percentage of the fair market value that is determined by local assessors to be the total taxable value of land and additions on the property. | Land | Improvement |
|---|---|---|---|---|
| 2025 | $5,727 | $33,000 | $5,179 | $27,821 |
| 2024 | $5,727 | $33,000 | $5,179 | $27,821 |
| 2023 | $5,585 | $27,000 | $4,624 | $22,376 |
| 2022 | $5,585 | $27,000 | $4,624 | $22,376 |
| 2021 | $5,429 | $26,999 | $4,623 | $22,376 |
| 2020 | $5,178 | $23,093 | $3,699 | $19,394 |
| 2019 | $5,188 | $25,659 | $3,699 | $21,960 |
| 2018 | $5,338 | $26,848 | $3,699 | $23,149 |
| 2017 | $4,831 | $22,292 | $3,329 | $18,963 |
| 2016 | $3,991 | $22,292 | $3,329 | $18,963 |
| 2015 | $3,630 | $22,292 | $3,329 | $18,963 |
| 2014 | $3,222 | $19,800 | $3,144 | $16,656 |
| 2013 | $3,148 | $19,800 | $3,144 | $16,656 |
Source: Public Records
Map
Nearby Homes
- 6319 S Oak Park Ave Unit 3B
- 6237 S Newland Ave Unit 1N
- 6721 W 63rd St
- 6732 W 64th Place Unit 2E
- 6728 W 64th Place Unit 2A
- 6728 W 64th Place Unit 2B
- 6816 W 65th St Unit 5
- 6925 W 64th Place Unit 3F
- 7021 W 64th St
- 6628 W 63rd Place
- 7051 W 64th Place
- 6305 S Nashville Ave Unit 2S
- 6051 S Normandy Ave
- 7140 W 64th St
- 6525 W 64th Place Unit 1W
- 7216 W 63rd Place
- 7224 W 63rd Place
- 6430 W 64th Place
- 5819 S Newcastle Ave
- 6323 W 64th Place Unit 1D
- 6815 W 63rd St
- 6815 W 63rd St Unit 1-9
- 6815 W 63rd St Unit 11
- 6815 W 63rd St Unit 7-8
- 6815 W 63rd St Unit 7-10
- 6815 W 63rd St Unit 5
- 6807 W 63rd St
- 6817 W 63rd St
- 6805 W 63rd St
- 6821 W 63rd St
- 6801 W 63rd St
- 6314 S Oak Park Ave
- 6823 W 63rd St
- 6316 S Oak Park Ave
- 6814 W 63rd Place
- 6825 W 63rd St
- 6818 W 63rd Place
- 6320 S Oak Park Ave
- 6829 W 63rd St
- 6322 S Oak Park Ave
Your Personal Tour Guide
Ask me questions while you tour the home.