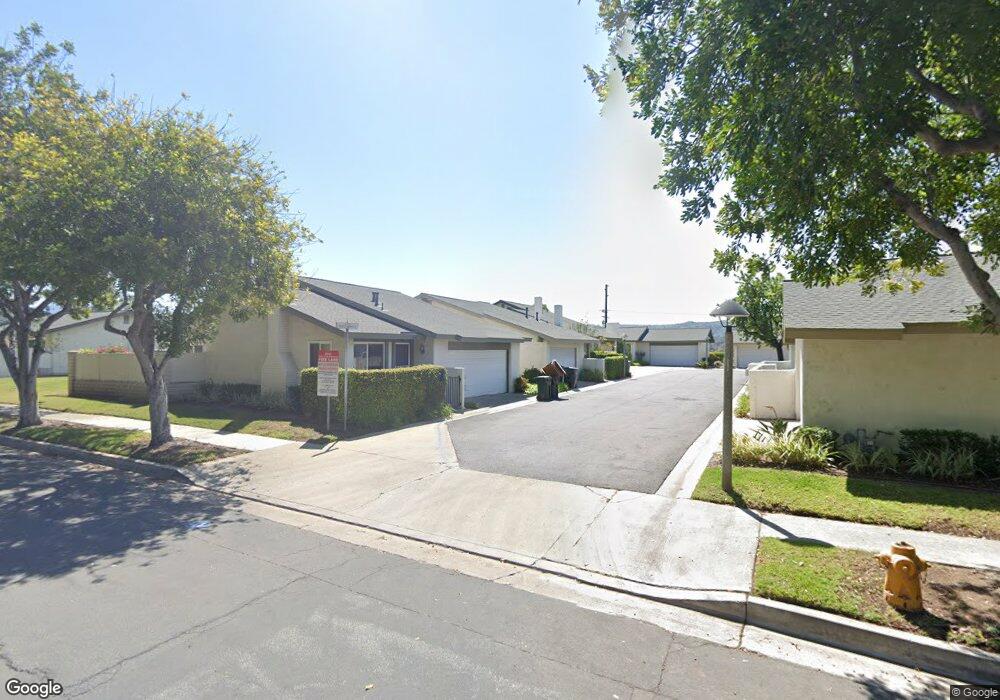
6812 Maple Grove Ct Unit 18 Yorba Linda, CA 92886
Estimated Value: $748,000 - $923,000
3
Beds
2
Baths
1,041
Sq Ft
$775/Sq Ft
Est. Value
About This Home
This home is located at 6812 Maple Grove Ct Unit 18, Yorba Linda, CA 92886 and is currently estimated at $806,380, approximately $774 per square foot. 6812 Maple Grove Ct Unit 18 is a home located in Orange County with nearby schools including Glenknoll Elementary, Bernardo Yorba Middle School, and Ivycrest Montessori Private School - Yorba Linda.
Ownership History
Date
Name
Owned For
Owner Type
Purchase Details
Closed on
Sep 11, 2020
Sold by
Turner Arthur A and Turner Family Trust
Bought by
Turner Arthur A and The Turner Family Trust
Current Estimated Value
Purchase Details
Closed on
Dec 20, 2007
Sold by
Turner Arthur A
Bought by
Turner Arthur A and Turner Doloris G
Purchase Details
Closed on
Oct 30, 2003
Sold by
Turner Arthur A
Bought by
Turner Arthur A and The Turner Family Trust
Home Financials for this Owner
Home Financials are based on the most recent Mortgage that was taken out on this home.
Original Mortgage
$158,000
Outstanding Balance
$64,212
Interest Rate
4.24%
Mortgage Type
Negative Amortization
Estimated Equity
$742,168
Purchase Details
Closed on
May 15, 2001
Sold by
Wong Linda Hoiling
Bought by
Turner Arthur A and The Turner Family Trust
Home Financials for this Owner
Home Financials are based on the most recent Mortgage that was taken out on this home.
Original Mortgage
$159,200
Interest Rate
7.37%
Create a Home Valuation Report for This Property
The Home Valuation Report is an in-depth analysis detailing your home's value as well as a comparison with similar homes in the area
Home Values in the Area
Average Home Value in this Area
Purchase History
| Date | Buyer | Sale Price | Title Company |
|---|---|---|---|
| Turner Arthur A | -- | None Available | |
| Turner Arthur A | -- | None Available | |
| Turner Arthur A | -- | -- | |
| Turner Arthur A | -- | First American Title Co | |
| Turner Arthur A | $199,000 | Stewart Title |
Source: Public Records
Mortgage History
| Date | Status | Borrower | Loan Amount |
|---|---|---|---|
| Open | Turner Arthur A | $158,000 | |
| Closed | Turner Arthur A | $159,200 |
Source: Public Records
Tax History Compared to Growth
Tax History
| Year | Tax Paid | Tax Assessment Tax Assessment Total Assessment is a certain percentage of the fair market value that is determined by local assessors to be the total taxable value of land and additions on the property. | Land | Improvement |
|---|---|---|---|---|
| 2025 | $7,743 | $707,472 | $627,527 | $79,945 |
| 2024 | $7,743 | $693,600 | $615,222 | $78,378 |
| 2023 | $3,519 | $288,208 | $204,469 | $83,739 |
| 2022 | $3,482 | $282,557 | $200,459 | $82,098 |
| 2021 | $3,420 | $277,017 | $196,528 | $80,489 |
| 2020 | $3,359 | $274,177 | $194,513 | $79,664 |
| 2019 | $3,247 | $268,801 | $190,699 | $78,102 |
| 2018 | $3,208 | $263,531 | $186,960 | $76,571 |
| 2017 | $3,157 | $258,364 | $183,294 | $75,070 |
| 2016 | $3,191 | $253,299 | $179,700 | $73,599 |
| 2015 | $3,153 | $249,495 | $177,001 | $72,494 |
| 2014 | $3,064 | $244,608 | $173,534 | $71,074 |
Source: Public Records
Map
Nearby Homes
- 6821 Rocky Grove Ct Unit 13
- 20205 Brightwood Ct Unit 27
- 20001 Wildwood Ct Unit 7
- 20022 Pineville Ct Unit 56
- 6478 Horse Shoe Ln Unit 9
- 6473 Horse Shoe Ln Unit 6
- 6437 Horse Shoe Ln Unit 2
- 19816 White Spring Ln Unit 36
- 20020 Clear River Ln Unit 40
- 6692 Palma Cir
- 20267 Clear River Ln Unit 7
- 6681 Palma Cir
- 20359 Ivy Hill Ln Unit 13
- 6692 Moselle Cir
- 5815 E La Palma Ave Unit 133
- 5815 E La Palma Ave Unit 190
- 5815 E La Palma Ave Unit 74
- 5815 E La Palma Ave Unit 224
- 5815 E La Palma Ave Unit 62
- 20065 Berkeley Way
- 6802 Maple Grove Ct
- 6822 Maple Grove Ct Unit 19
- 6822 Maple Grove Ct
- 6801 Rocky Grove Ct Unit 15
- 6811 Maple Grove Ct Unit 23
- 6832 Maple Grove Ct Unit 20
- 6832 Maple Grove Ct
- 6791 Rocky Grove Ct Unit 16
- 6811 Rocky Grove Ct Unit 14
- 6801 Maple Grove Ct Unit 24
- 6801 Maple Grove Ct
- 6821 Maple Grove Ct
- 6831 Maple Grove Ct Unit 21
- 6821 Rocky Grove Ct
- 6802 Elmhurst Ct Unit 25
- 6802 Elmhurst Ct
- 6812 Elmhurst Ct
- 6822 Elmhurst Ct Unit 27
- 6822 Rocky Grove Ct
- 6802 Rocky Grove Ct Unit 10