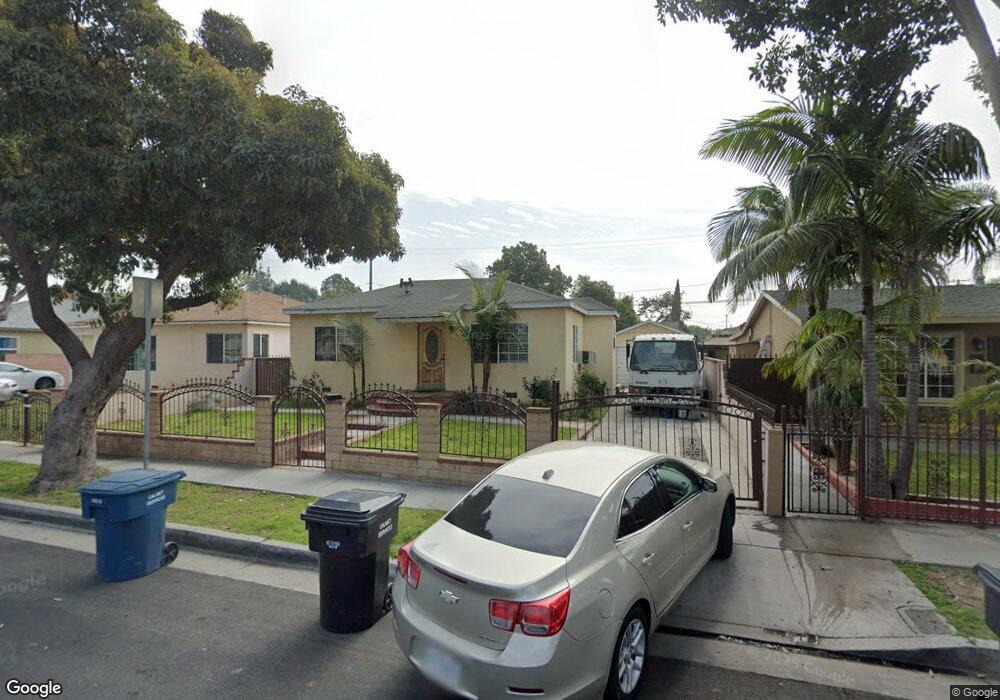
6812 San Juan St Paramount, CA 90723
Estimated Value: $587,328 - $824,000
2
Beds
2
Baths
2,919
Sq Ft
$231/Sq Ft
Est. Value
About This Home
This home is located at 6812 San Juan St, Paramount, CA 90723 and is currently estimated at $675,582, approximately $231 per square foot. 6812 San Juan St is a home located in Los Angeles County with nearby schools including Howard Tanner School, Frank J. Zamboni School, and Paramount High School.
Ownership History
Date
Name
Owned For
Owner Type
Purchase Details
Closed on
Jul 6, 2020
Sold by
Perez Leticia
Bought by
Perez Jessica and Perez Leticia
Current Estimated Value
Home Financials for this Owner
Home Financials are based on the most recent Mortgage that was taken out on this home.
Original Mortgage
$150,000
Outstanding Balance
$105,978
Interest Rate
3.1%
Mortgage Type
New Conventional
Estimated Equity
$569,604
Purchase Details
Closed on
Jun 7, 2011
Sold by
Perez Jorge
Bought by
Perez Leticia and Perez Guadalupe
Purchase Details
Closed on
Jun 6, 2011
Sold by
Perez Leticia
Bought by
Perez Leticia
Purchase Details
Closed on
Mar 24, 1997
Sold by
Texas Commerce Bank Na
Bought by
Perez Jorge and Perez Leticia
Home Financials for this Owner
Home Financials are based on the most recent Mortgage that was taken out on this home.
Original Mortgage
$91,718
Interest Rate
7.86%
Mortgage Type
FHA
Purchase Details
Closed on
Nov 22, 1996
Sold by
Banuelos Salvador V and Banuelos Alicia
Bought by
Texas Commerce Bank Na
Create a Home Valuation Report for This Property
The Home Valuation Report is an in-depth analysis detailing your home's value as well as a comparison with similar homes in the area
Home Values in the Area
Average Home Value in this Area
Purchase History
| Date | Buyer | Sale Price | Title Company |
|---|---|---|---|
| Perez Jessica | -- | Chicago Title Company | |
| Perez Leticia | -- | None Available | |
| Perez Leticia | -- | None Available | |
| Perez Jorge | $92,000 | -- | |
| Texas Commerce Bank Na | $102,000 | Benefit Land Title Ins Co |
Source: Public Records
Mortgage History
| Date | Status | Borrower | Loan Amount |
|---|---|---|---|
| Open | Perez Jessica | $150,000 | |
| Previous Owner | Perez Jorge | $91,718 |
Source: Public Records
Tax History Compared to Growth
Tax History
| Year | Tax Paid | Tax Assessment Tax Assessment Total Assessment is a certain percentage of the fair market value that is determined by local assessors to be the total taxable value of land and additions on the property. | Land | Improvement |
|---|---|---|---|---|
| 2025 | $2,881 | $615,763 | $113,995 | $501,768 |
| 2024 | $2,881 | $191,584 | $111,760 | $79,824 |
| 2023 | $2,956 | $187,828 | $109,569 | $78,259 |
| 2022 | $2,758 | $184,146 | $107,421 | $76,725 |
| 2021 | $2,695 | $180,536 | $105,315 | $75,221 |
| 2019 | $2,751 | $175,184 | $102,193 | $72,991 |
| 2018 | $2,523 | $171,750 | $100,190 | $71,560 |
| 2017 | $73 | $168,383 | $98,226 | $70,157 |
| 2016 | $2,272 | $165,082 | $96,300 | $68,782 |
| 2015 | $2,151 | $162,603 | $94,854 | $67,749 |
| 2014 | $2,203 | $159,418 | $92,996 | $66,422 |
Source: Public Records
Map
Nearby Homes
- 6626 San Miguel St
- 6846 San Vincente St
- 6556 San Vincente St
- 7029 Somerset Blvd
- 7221 Petrol St Unit 6
- 7260 Richfield St Unit 318
- 7260 Richfield St Unit 305
- 15325 Orange Ave
- 15311 Gundry Ave Unit 2
- 15311 Gundry Ave Unit 16
- 15311 Gundry Ave Unit 29
- 15351 Orange Ave Unit 25
- 12323 Edgebrook Ave
- 5506 Pelleur St
- 14708 S Frailey Ave
- 4704 E Compton Blvd
- 15118 S Frailey Ave
- 4636 Cardwell St
- 3 Rosecrans Ave
- 15006 S Lime Ave
- 6818 San Juan St
- 6808 San Juan St
- 6822 San Juan St
- 14608 El Camino Ave
- 6813 San Miguel St
- 6819 San Miguel St
- 14614 El Camino Ave
- 6809 San Miguel St
- 6828 San Juan St
- 6809 San Vincente St
- 6833 San Juan St
- 6811 San Juan St
- 6823 San Miguel St
- 6803 San Miguel St
- 6803 San Vincente St
- 6817 San Juan St
- 6807 San Juan St
- 6832 San Carlos St
- 6832 San Juan St
- 6803 San Juan St