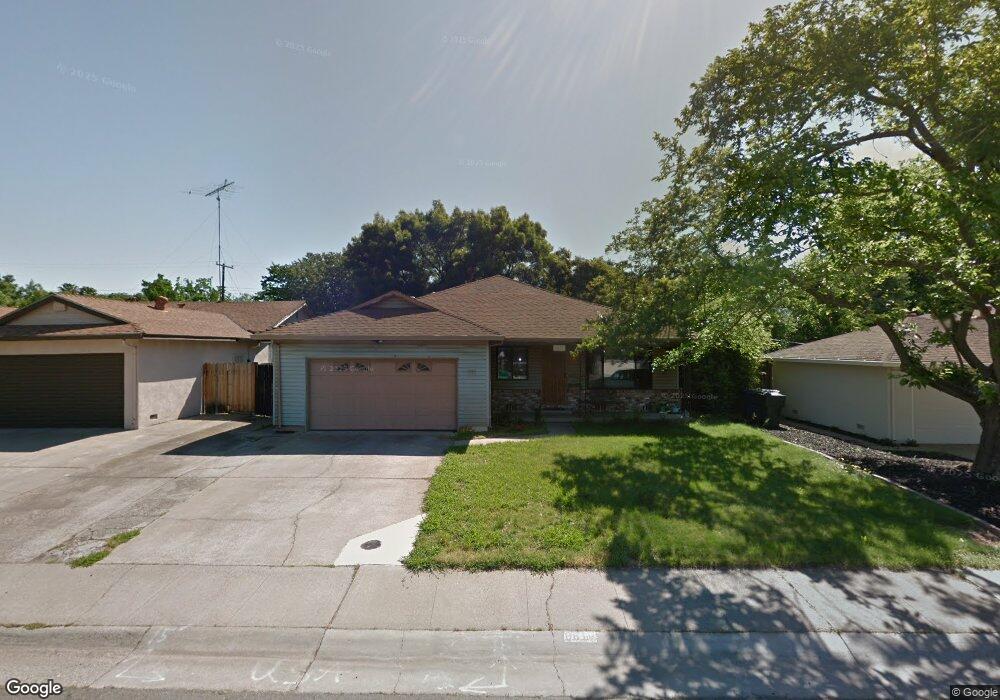
6813 Bender Ct Sacramento, CA 95820
Colonial Village North NeighborhoodEstimated Value: $394,000 - $524,000
3
Beds
2
Baths
1,132
Sq Ft
$418/Sq Ft
Est. Value
About This Home
This home is located at 6813 Bender Ct, Sacramento, CA 95820 and is currently estimated at $472,714, approximately $417 per square foot. 6813 Bender Ct is a home located in Sacramento County with nearby schools including Suy:u Elementary School, Umoja International Academy, and Hiram W. Johnson High School.
Ownership History
Date
Name
Owned For
Owner Type
Purchase Details
Closed on
Jul 22, 2020
Sold by
Frick Christopher A
Bought by
Frick Heather M
Current Estimated Value
Home Financials for this Owner
Home Financials are based on the most recent Mortgage that was taken out on this home.
Original Mortgage
$235,000
Outstanding Balance
$187,855
Interest Rate
3.2%
Mortgage Type
New Conventional
Estimated Equity
$284,859
Purchase Details
Closed on
May 18, 2005
Sold by
The Roger E Jr & Jenny L Williams Revoca
Bought by
Frick Christopher A and Frick Heather M
Home Financials for this Owner
Home Financials are based on the most recent Mortgage that was taken out on this home.
Original Mortgage
$256,000
Interest Rate
5.75%
Mortgage Type
New Conventional
Purchase Details
Closed on
May 17, 2000
Sold by
Lee Williams Roger E and Lee Jenny
Bought by
Williams Roger E and Williams Jenny L
Create a Home Valuation Report for This Property
The Home Valuation Report is an in-depth analysis detailing your home's value as well as a comparison with similar homes in the area
Home Values in the Area
Average Home Value in this Area
Purchase History
| Date | Buyer | Sale Price | Title Company |
|---|---|---|---|
| Frick Heather M | -- | Fidelity National Title Co | |
| Frick Christopher A | $320,000 | -- | |
| Williams Roger E | -- | -- |
Source: Public Records
Mortgage History
| Date | Status | Borrower | Loan Amount |
|---|---|---|---|
| Open | Frick Heather M | $235,000 | |
| Closed | Frick Christopher A | $256,000 |
Source: Public Records
Tax History Compared to Growth
Tax History
| Year | Tax Paid | Tax Assessment Tax Assessment Total Assessment is a certain percentage of the fair market value that is determined by local assessors to be the total taxable value of land and additions on the property. | Land | Improvement |
|---|---|---|---|---|
| 2025 | $5,192 | $446,029 | $139,378 | $306,651 |
| 2024 | $5,192 | $437,285 | $136,646 | $300,639 |
| 2023 | $5,069 | $428,712 | $133,967 | $294,745 |
| 2022 | $4,984 | $420,307 | $131,341 | $288,966 |
| 2021 | $4,746 | $412,066 | $128,766 | $283,300 |
| 2020 | $4,279 | $363,183 | $113,489 | $249,694 |
| 2019 | $3,963 | $336,282 | $105,083 | $231,199 |
| 2018 | $3,557 | $302,958 | $94,670 | $208,288 |
| 2017 | $3,207 | $270,499 | $84,527 | $185,972 |
| 2016 | $2,805 | $237,281 | $74,147 | $163,134 |
| 2015 | $2,603 | $219,705 | $68,655 | $151,050 |
| 2014 | $2,276 | $192,724 | $60,224 | $132,500 |
Source: Public Records
Map
Nearby Homes