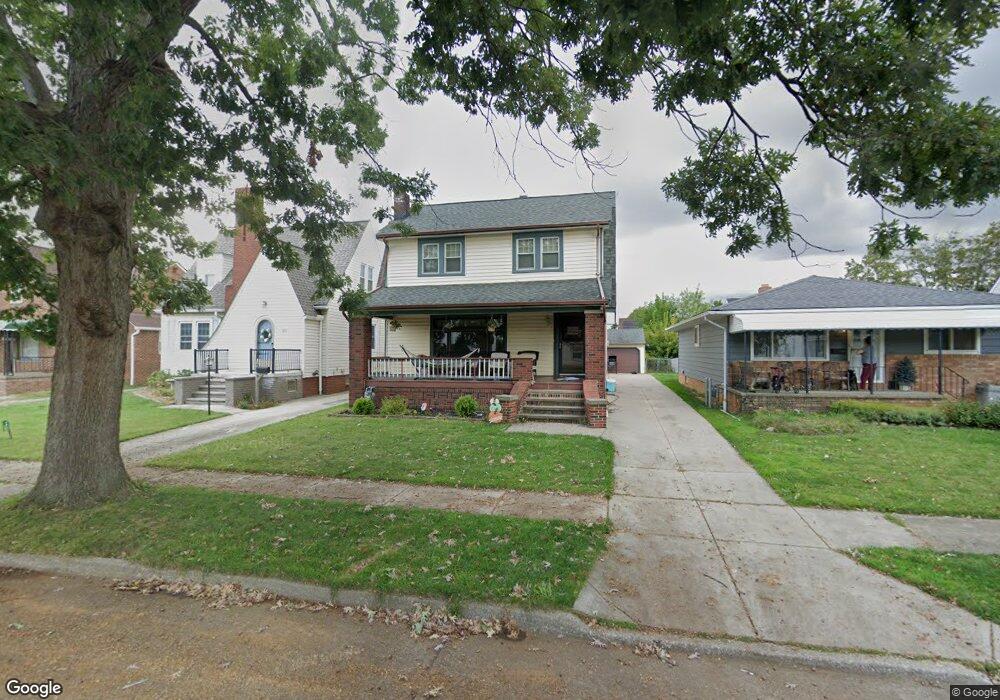
6814 Belmere Dr Cleveland, OH 44129
Estimated Value: $218,541 - $245,000
4
Beds
1
Bath
1,404
Sq Ft
$163/Sq Ft
Est. Value
About This Home
This home is located at 6814 Belmere Dr, Cleveland, OH 44129 and is currently estimated at $228,885, approximately $163 per square foot. 6814 Belmere Dr is a home located in Cuyahoga County with nearby schools including Renwood Elementary School, Hillside Middle School, and Parma High School.
Ownership History
Date
Name
Owned For
Owner Type
Purchase Details
Closed on
May 25, 2018
Sold by
Shcultz Alan K
Bought by
Riehl Eward V and Riehl Nicole M
Current Estimated Value
Home Financials for this Owner
Home Financials are based on the most recent Mortgage that was taken out on this home.
Original Mortgage
$126,373
Outstanding Balance
$109,674
Interest Rate
4.75%
Mortgage Type
FHA
Estimated Equity
$119,211
Purchase Details
Closed on
Oct 13, 2017
Sold by
Schultz Alan K and Schultz Wendy M
Bought by
Schultz Alan K
Purchase Details
Closed on
Jun 6, 1995
Sold by
Shea Thomas F
Bought by
Schultz Alan K and Schultz Wendy M
Home Financials for this Owner
Home Financials are based on the most recent Mortgage that was taken out on this home.
Original Mortgage
$98,900
Interest Rate
8.26%
Purchase Details
Closed on
May 26, 1983
Sold by
Sovish Susan
Bought by
Shea Thomas T
Purchase Details
Closed on
Jan 1, 1975
Bought by
Sovish Susan
Create a Home Valuation Report for This Property
The Home Valuation Report is an in-depth analysis detailing your home's value as well as a comparison with similar homes in the area
Home Values in the Area
Average Home Value in this Area
Purchase History
| Date | Buyer | Sale Price | Title Company |
|---|---|---|---|
| Riehl Eward V | $130,000 | Ohio Title Corp | |
| Schultz Alan K | -- | None Available | |
| Schultz Alan K | $109,900 | -- | |
| Shea Thomas T | $57,900 | -- | |
| Sovish Susan | -- | -- |
Source: Public Records
Mortgage History
| Date | Status | Borrower | Loan Amount |
|---|---|---|---|
| Open | Riehl Eward V | $126,373 | |
| Previous Owner | Schultz Alan K | $98,900 |
Source: Public Records
Tax History Compared to Growth
Tax History
| Year | Tax Paid | Tax Assessment Tax Assessment Total Assessment is a certain percentage of the fair market value that is determined by local assessors to be the total taxable value of land and additions on the property. | Land | Improvement |
|---|---|---|---|---|
| 2024 | $3,864 | $64,120 | $10,640 | $53,480 |
| 2023 | $3,288 | $46,590 | $9,380 | $37,210 |
| 2022 | $3,256 | $46,590 | $9,380 | $37,210 |
| 2021 | $3,350 | $46,590 | $9,380 | $37,210 |
| 2020 | $2,931 | $35,840 | $7,210 | $28,630 |
| 2019 | $2,809 | $102,400 | $20,600 | $81,800 |
| 2018 | $2,727 | $35,840 | $7,210 | $28,630 |
| 2017 | $2,727 | $31,470 | $5,360 | $26,110 |
| 2016 | $2,710 | $31,470 | $5,360 | $26,110 |
| 2015 | $1,876 | $31,470 | $5,360 | $26,110 |
| 2014 | $1,876 | $32,100 | $5,460 | $26,640 |
Source: Public Records
Map
Nearby Homes
- 6298 Chestnut Hills Dr
- 6510 Belmere Dr
- 6234 N Canterbury Rd
- 6227 Ridge Rd
- 6921 Hollywood Dr
- 6701 Pelham Dr
- 6474 Ridge Rd
- 6111 Manchester Rd
- 6136 Ridge Rd
- 6430 Monmouth Dr
- 6096 Wareham Dr
- 6610 Renwood Dr
- 6485 Buckingham Dr
- 5700 Hollywood Dr
- 6439 Keltonshire Rd
- 8017 Ackley Rd
- 8017 Wainstead Dr
- 5415 Pelham Dr
- 7503 Whittington Dr
- 6708 Thornton Dr
- 6810 Belmere Dr
- 6818 Belmere Dr
- 6806 Belmere Dr
- 6822 Belmere Dr
- 6802 Belmere Dr
- 6826 Belmere Dr
- 6815 Ackley Rd
- 6811 Ackley Rd
- 6821 Ackley Rd
- 6807 Ackley Rd
- 6710 Belmere Dr
- 6902 Belmere Dr
- 6825 Ackley Rd
- 6803 Ackley Rd
- 6815 Belmere Dr
- 6811 Belmere Dr
- 6821 Belmere Dr
- 6907 Ackley Rd
- 6903 Ackley Rd
- 6807 Belmere Dr