6814 Brandt Rd Unit Lot 12 Carroll, OH 43112
Bloom NeighborhoodEstimated Value: $351,000 - $1,234,139
3
Beds
2
Baths
1,981
Sq Ft
$360/Sq Ft
Est. Value
About This Home
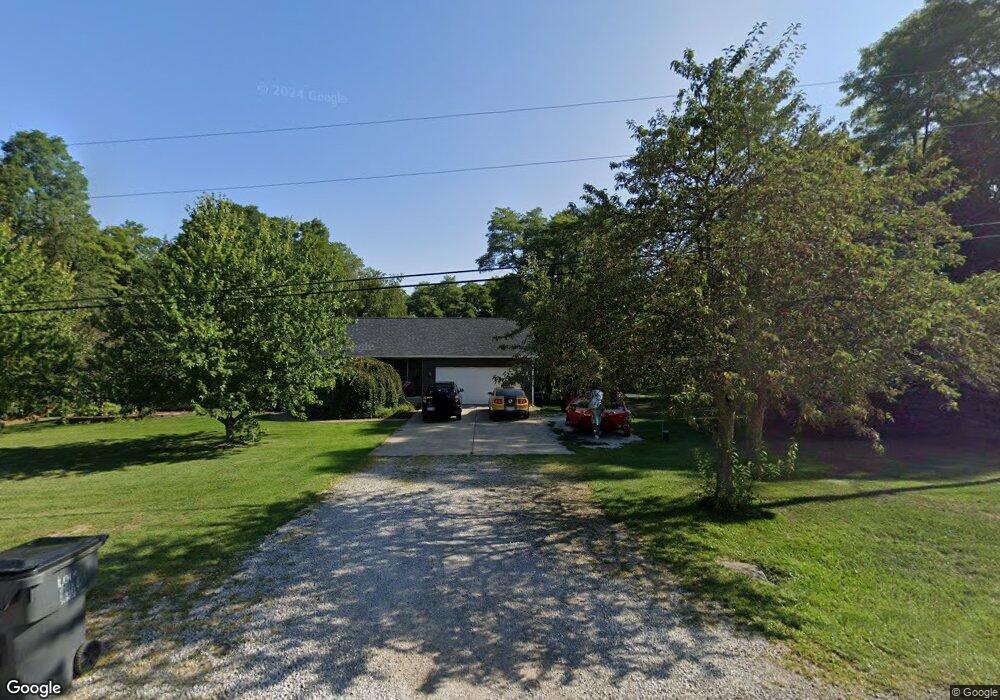
This home is located at 6814 Brandt Rd Unit Lot 12, Carroll, OH 43112 and is currently estimated at $712,785, approximately $359 per square foot. 6814 Brandt Rd Unit Lot 12 is a home located in Fairfield County with nearby schools including Bloom Carroll Primary School, Bloom Carroll Intermediate School, and Bloom-Carroll Middle School.
Ownership History
Date
Name
Owned For
Owner Type
Purchase Details
Closed on
May 20, 2020
Sold by
Wolfinger Family Farms Llc
Bought by
Price-Seaton Llc
Current Estimated Value
Home Financials for this Owner
Home Financials are based on the most recent Mortgage that was taken out on this home.
Original Mortgage
$1,435,000
Outstanding Balance
$1,268,821
Interest Rate
3.3%
Mortgage Type
New Conventional
Estimated Equity
-$556,036
Purchase Details
Closed on
Apr 28, 2017
Sold by
Wolfinger Farms
Bought by
Wolfinger Family Farms Llc
Create a Home Valuation Report for This Property
The Home Valuation Report is an in-depth analysis detailing your home's value as well as a comparison with similar homes in the area
Home Values in the Area
Average Home Value in this Area
Purchase History
| Date | Buyer | Sale Price | Title Company |
|---|---|---|---|
| Price-Seaton Llc | $7,059,200 | Hocking Valley Title | |
| Price-Seaton Llc | $7,059,200 | Hocking Valley Title | |
| Wolfinger Family Farms Llc | $877,000 | None Available | |
| Wolfinger Family Farms Llc | $877,000 | None Available |
Source: Public Records
Mortgage History
| Date | Status | Borrower | Loan Amount |
|---|---|---|---|
| Open | Price-Seaton Llc | $1,435,000 |
Source: Public Records
Tax History Compared to Growth
Tax History
| Year | Tax Paid | Tax Assessment Tax Assessment Total Assessment is a certain percentage of the fair market value that is determined by local assessors to be the total taxable value of land and additions on the property. | Land | Improvement |
|---|---|---|---|---|
| 2024 | $22,115 | $268,390 | $268,390 | -- |
| 2023 | $31,708 | $731,750 | $695,940 | $35,810 |
| 2022 | $31,948 | $731,750 | $695,940 | $35,810 |
| 2021 | $31,798 | $658,500 | $632,670 | $25,830 |
| 2020 | $32,038 | $658,500 | $632,670 | $25,830 |
| 2019 | $3,309 | $221,150 | $205,230 | $15,920 |
| 2018 | $3,816 | $176,810 | $164,360 | $12,450 |
| 2017 | $3,601 | $176,080 | $163,630 | $12,450 |
| 2016 | $3,469 | $175,730 | $163,280 | $12,450 |
| 2015 | $3,276 | $175,160 | $163,280 | $11,880 |
| 2014 | $3,126 | $175,160 | $163,280 | $11,880 |
| 2013 | $3,126 | $175,160 | $163,280 | $11,880 |
Source: Public Records
Map
Nearby Homes
- 4180 Stone Hill Drive East NW
- 6920 Winchester Rd NW
- 4900 Pickerington Rd NW
- 8322 Benson Rd
- 62 Oberle Ave
- 2155 Carroll-Southern Rd NW
- 52 W Canal St
- 5341 Carnes Rd
- 7985 Lithopolis Rd NW
- 5560 Amanda Northern Rd NW
- 1975 Lamb Rd NW
- 5311 Mason Rd NW
- 4656 Meadow Grove Dr NW
- 5726 Bish Rd
- 3738 Arrowhead Dr NW
- 7234 Pickerington Rd
- 7936 Allen Rd
- 7190 Amanda Northern Rd NW
- 839 Rockmill Rd NW
- 10385 Lithopolis Rd NW
- 6814 Brandt Rd Unit Lot 17
- 6814 Brandt Rd Unit Lot 16
- 6814 Brandt Rd Unit Lot 15
- 6814 Brandt Rd Unit Lot 14
- 6814 Brandt Rd Unit Lot 13
- 6814 Brandt Rd Unit Lot 11
- 6814 Brandt Rd Unit Lot 10
- 6814 Brandt Rd Unit Lot 7
- 6814 Brandt Rd Unit Lot 3
- 6814 Brandt Rd Unit Lot 2
- 6814 Brandt Rd Unit Lot 1
- 7122 Brandt Rd
- 7100 Brandt Rd
- 7170 Brandt Rd
- 7072 Brandt Rd
- 7140 Brandt Rd
- 7218 Brandt Rd
- 6918 Brandt Rd
- 7024 Brandt Rd
- 7165 Brandt Rd