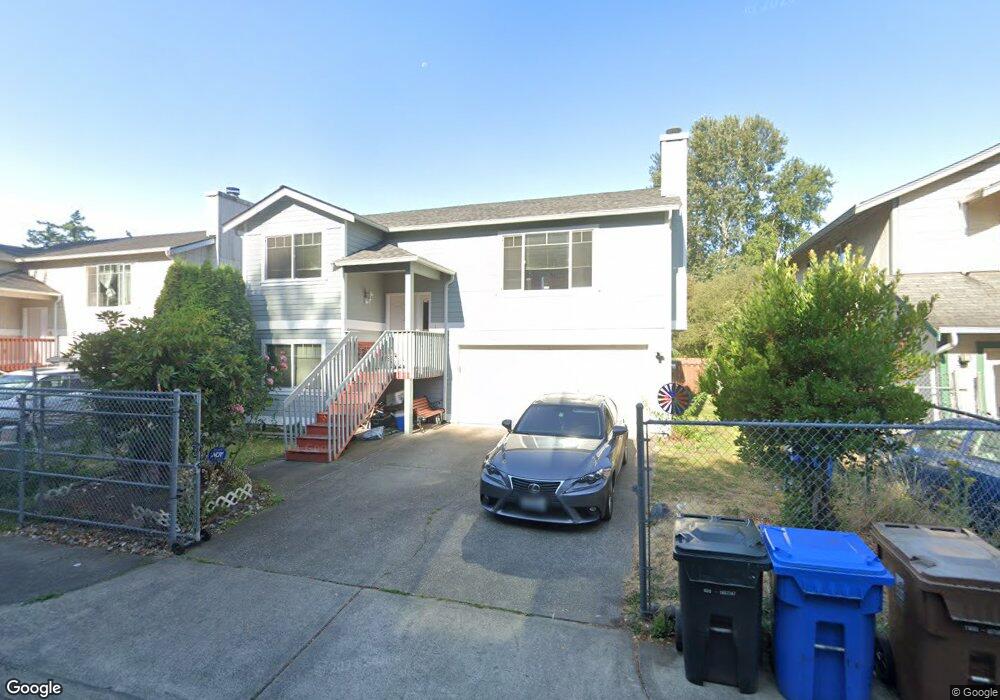
6814 E J St Tacoma, WA 98404
Eastside NeighborhoodEstimated Value: $411,000 - $466,000
3
Beds
2
Baths
1,368
Sq Ft
$326/Sq Ft
Est. Value
About This Home
This home is located at 6814 E J St, Tacoma, WA 98404 and is currently estimated at $446,198, approximately $326 per square foot. 6814 E J St is a home located in Pierce County with nearby schools including Boze, First Creek Middle School, and Lincoln High School.
Ownership History
Date
Name
Owned For
Owner Type
Purchase Details
Closed on
Jul 30, 2021
Sold by
Teav Oeum Katherine
Bought by
Teav Oeun Katherine and Maurer Martha
Current Estimated Value
Home Financials for this Owner
Home Financials are based on the most recent Mortgage that was taken out on this home.
Original Mortgage
$64,900
Outstanding Balance
$50,015
Interest Rate
3%
Mortgage Type
New Conventional
Estimated Equity
$396,183
Purchase Details
Closed on
Jan 29, 1998
Sold by
J S C Development Inc
Bought by
Maurer Richard J and Katherine Teav O
Home Financials for this Owner
Home Financials are based on the most recent Mortgage that was taken out on this home.
Original Mortgage
$87,950
Interest Rate
7.05%
Purchase Details
Closed on
Jul 18, 1996
Sold by
Piland Michael B
Bought by
J S C Development Inc
Create a Home Valuation Report for This Property
The Home Valuation Report is an in-depth analysis detailing your home's value as well as a comparison with similar homes in the area
Home Values in the Area
Average Home Value in this Area
Purchase History
| Date | Buyer | Sale Price | Title Company |
|---|---|---|---|
| Teav Oeun Katherine | $59,418 | Ticor Title | |
| Maurer Richard J | $127,915 | Fidelity National Title Ins | |
| J S C Development Inc | $178,296 | Chicago Title Insurance Co |
Source: Public Records
Mortgage History
| Date | Status | Borrower | Loan Amount |
|---|---|---|---|
| Open | Teav Oeun Katherine | $64,900 | |
| Previous Owner | Maurer Richard J | $87,950 |
Source: Public Records
Tax History Compared to Growth
Tax History
| Year | Tax Paid | Tax Assessment Tax Assessment Total Assessment is a certain percentage of the fair market value that is determined by local assessors to be the total taxable value of land and additions on the property. | Land | Improvement |
|---|---|---|---|---|
| 2025 | $3,953 | $399,800 | $169,800 | $230,000 |
| 2024 | $3,953 | $380,700 | $163,400 | $217,300 |
| 2023 | $3,953 | $354,800 | $157,000 | $197,800 |
| 2022 | $3,686 | $374,800 | $160,900 | $213,900 |
| 2021 | $3,453 | $274,500 | $99,900 | $174,600 |
| 2019 | $2,907 | $248,500 | $83,300 | $165,200 |
| 2018 | $3,021 | $223,500 | $67,700 | $155,800 |
| 2017 | $2,646 | $191,100 | $51,000 | $140,100 |
| 2016 | $2,318 | $146,300 | $38,600 | $107,700 |
| 2014 | $1,983 | $133,200 | $35,300 | $97,900 |
| 2013 | $1,983 | $117,900 | $31,400 | $86,500 |
Source: Public Records
Map
Nearby Homes