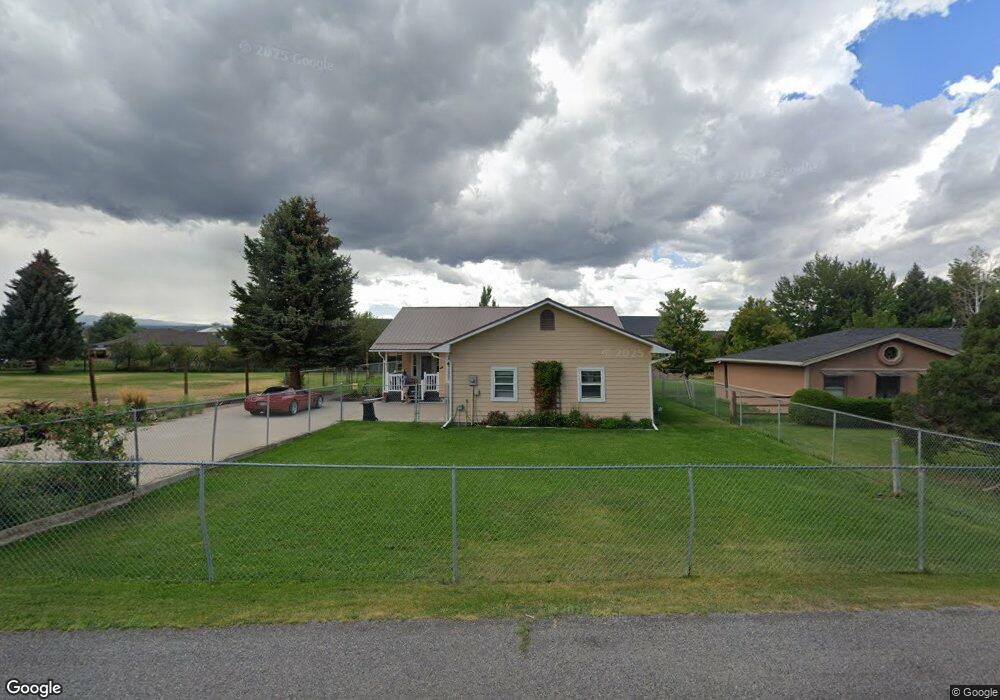
68151 Tumbleweed Rd Montrose, CO 81403
Estimated Value: $580,000 - $835,000
4
Beds
3
Baths
1,940
Sq Ft
$336/Sq Ft
Est. Value
About This Home
This home is located at 68151 Tumbleweed Rd, Montrose, CO 81403 and is currently estimated at $651,537, approximately $335 per square foot. 68151 Tumbleweed Rd is a home located in Montrose County with nearby schools including Cottonwood Elementary School, Centennial Middle School, and Montrose High School.
Ownership History
Date
Name
Owned For
Owner Type
Purchase Details
Closed on
Sep 12, 2016
Sold by
Moreland David J and Moreland Linda S
Bought by
The David J And Linda S Moreland Living
Current Estimated Value
Purchase Details
Closed on
Sep 11, 2015
Sold by
Chapin Jim Edward
Bought by
Moreland David J and Moreland Linda S
Purchase Details
Closed on
Oct 13, 2011
Sold by
Chapin Jim Edward and Chapin Dell Nathan
Bought by
Chapin Kory Lynn
Purchase Details
Closed on
Aug 15, 1997
Sold by
Darrigo Kathleen J
Bought by
Chapin Jim Edward and Chapin Barbara Lou
Purchase Details
Closed on
Dec 30, 1994
Sold by
Guthrie James W and Guthrie Clorinda C
Bought by
Darrigo Kathleen J
Purchase Details
Closed on
Oct 20, 1993
Sold by
Robins Jack L
Bought by
Guthrie James W and Guthrie Clorinda C
Purchase Details
Closed on
Feb 13, 1992
Sold by
First National Bank Of Montrose
Bought by
Robins Jack L
Purchase Details
Closed on
Apr 26, 1985
Sold by
Shinn Park Ranch
Bought by
United Bank Of Montrose
Create a Home Valuation Report for This Property
The Home Valuation Report is an in-depth analysis detailing your home's value as well as a comparison with similar homes in the area
Home Values in the Area
Average Home Value in this Area
Purchase History
| Date | Buyer | Sale Price | Title Company |
|---|---|---|---|
| The David J And Linda S Moreland Living | -- | None Available | |
| Moreland David J | $238,500 | Land Title Guarantee Company | |
| Chapin Kory Lynn | -- | None Available | |
| Chapin Jim Edward | $159,900 | -- | |
| Darrigo Kathleen J | $145,000 | -- | |
| Guthrie James W | $18,000 | -- | |
| Robins Jack L | $9,500 | -- | |
| United Bank Of Montrose | -- | -- |
Source: Public Records
Tax History Compared to Growth
Tax History
| Year | Tax Paid | Tax Assessment Tax Assessment Total Assessment is a certain percentage of the fair market value that is determined by local assessors to be the total taxable value of land and additions on the property. | Land | Improvement |
|---|---|---|---|---|
| 2024 | $2,298 | $32,270 | $6,250 | $26,020 |
| 2023 | $2,298 | $37,300 | $7,230 | $30,070 |
| 2022 | $1,730 | $25,140 | $4,870 | $20,270 |
| 2021 | $1,783 | $25,870 | $5,010 | $20,860 |
| 2020 | $1,373 | $20,460 | $2,590 | $17,870 |
| 2019 | $1,382 | $20,460 | $2,590 | $17,870 |
| 2018 | $1,305 | $18,850 | $3,060 | $15,790 |
| 2017 | $1,294 | $18,850 | $3,060 | $15,790 |
| 2016 | $1,225 | $18,140 | $3,030 | $15,110 |
| 2015 | $1,203 | $18,140 | $3,030 | $15,110 |
| 2014 | $1,038 | $16,740 | $3,030 | $13,710 |
Source: Public Records
Map
Nearby Homes
- 68143 Tumbleweed Rd
- 20866 Trophy Rd
- 68053 Tumbleweed Rd
- 21179 Highway 550
- Lot 4 6785 Ct
- Lot 1 6785 Ct
- Lot 3 6785 Ct
- Lot 49 6840 Rd
- Lot 43 6840 Rd
- Lot 50 6840 Rd
- Lot 48 6840 Rd
- 20677 Tulip Cir
- 20547 Tulip Cir
- 21475 Highway 550
- 68200 Ute Valley Dr
- TBD Ute Valley Dr Unit Lot 1
- TBD Ute Valley Dr Unit Lot 2
- 21446 Uncompahgre Rd
- Lot 2 Trout Rd
- Lot 3 Trout Rd
- 68135 Tumbleweed Rd
- 0 Trophy Rd Unit 760143
- 0 Trophy Rd Unit 756252
- 0 Trophy Rd Unit 751953
- 0 Trophy Rd Unit 599573
- 0 Trophy Rd Unit 735433
- 0 Trophy Rd Unit 622774
- 0 Trophy Rd Unit 662895
- 0 Trophy Rd Unit 662760
- 0 Trophy Rd Unit 664008
- 0 Trophy Rd Unit 675327
- 0 Trophy Rd Unit 698237
- 0 Trophy Rd Unit 714144
- 0 Trophy Rd Unit 714222
- 0 Trophy Rd Unit 728899
- 0 Trophy Rd Unit 733004
- 0 Trophy Rd Unit 733001
- 0 Trophy Rd Unit 616106
- 0 Trophy Rd Unit 619917
- 0 Trophy Rd Unit 643698