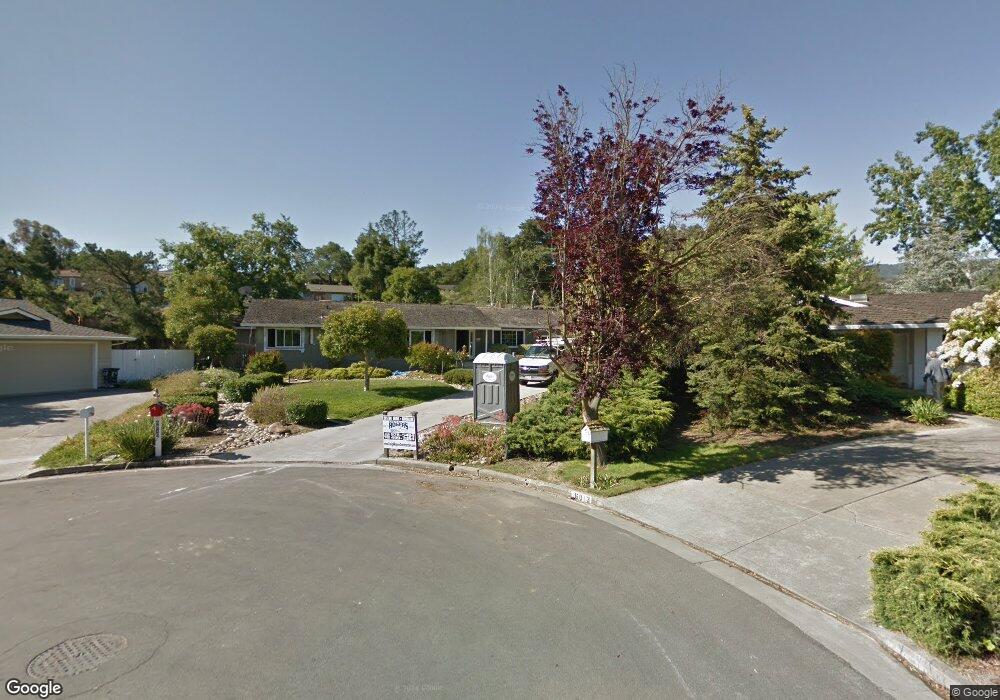
6816 Chateau Ct San Jose, CA 95120
Country Club NeighborhoodEstimated Value: $2,622,000 - $3,059,000
4
Beds
4
Baths
2,224
Sq Ft
$1,274/Sq Ft
Est. Value
About This Home
This home is located at 6816 Chateau Ct, San Jose, CA 95120 and is currently estimated at $2,832,618, approximately $1,273 per square foot. 6816 Chateau Ct is a home located in Santa Clara County with nearby schools including Williams Elementary School, Bret Harte Middle School, and Leland High School.
Ownership History
Date
Name
Owned For
Owner Type
Purchase Details
Closed on
Aug 23, 2011
Sold by
Cappelletti John D and Cappelletti Ashley R
Bought by
Cappelletti John David and Cappelletti Ashley Robin
Current Estimated Value
Home Financials for this Owner
Home Financials are based on the most recent Mortgage that was taken out on this home.
Original Mortgage
$1,000,000
Outstanding Balance
$687,853
Interest Rate
4.43%
Mortgage Type
New Conventional
Estimated Equity
$2,144,765
Purchase Details
Closed on
Jul 15, 2010
Sold by
Cappelletti John D and Cappelletti Ashley R
Bought by
Cappelletti John D and Cappelletti Ashley R
Purchase Details
Closed on
Oct 20, 2006
Sold by
Cappelletti James D and Cappelletti Ashley R
Bought by
Cappelletti John D and Cappelletti Ashley R
Home Financials for this Owner
Home Financials are based on the most recent Mortgage that was taken out on this home.
Original Mortgage
$187,500
Interest Rate
6.46%
Mortgage Type
Credit Line Revolving
Purchase Details
Closed on
Oct 12, 2006
Sold by
Bagan James P and Bagan Catherine A
Bought by
Cappelletti John D and Cappelletti Ashley R
Home Financials for this Owner
Home Financials are based on the most recent Mortgage that was taken out on this home.
Original Mortgage
$187,500
Interest Rate
6.46%
Mortgage Type
Credit Line Revolving
Purchase Details
Closed on
Aug 28, 2006
Sold by
Bagan Catherine A
Bought by
Bagan James P and Bagan Catherine A
Home Financials for this Owner
Home Financials are based on the most recent Mortgage that was taken out on this home.
Original Mortgage
$187,500
Interest Rate
6.46%
Mortgage Type
Credit Line Revolving
Purchase Details
Closed on
Apr 21, 2004
Sold by
Bagan James P and Bagan Catherine A
Bought by
Bagan Catherine A
Home Financials for this Owner
Home Financials are based on the most recent Mortgage that was taken out on this home.
Original Mortgage
$787,500
Interest Rate
5.75%
Mortgage Type
New Conventional
Purchase Details
Closed on
Apr 22, 1998
Sold by
Lattin Laura A
Bought by
Bagan James P and Bagan Catherine A
Home Financials for this Owner
Home Financials are based on the most recent Mortgage that was taken out on this home.
Original Mortgage
$450,000
Interest Rate
7.06%
Create a Home Valuation Report for This Property
The Home Valuation Report is an in-depth analysis detailing your home's value as well as a comparison with similar homes in the area
Home Values in the Area
Average Home Value in this Area
Purchase History
| Date | Buyer | Sale Price | Title Company |
|---|---|---|---|
| Cappelletti John David | -- | Fidelity National Title Co | |
| Cappelletti John D | -- | None Available | |
| Cappelletti John D | -- | Accommodation | |
| Cappelletti John D | $1,250,000 | Chicago Title Company | |
| Bagan James P | -- | Alliance Title Company | |
| Bagan Catherine A | -- | Old Republic Title Company | |
| Bagan James P | $660,000 | First American Title Guarant |
Source: Public Records
Mortgage History
| Date | Status | Borrower | Loan Amount |
|---|---|---|---|
| Open | Cappelletti John David | $1,000,000 | |
| Closed | Cappelletti John D | $187,500 | |
| Closed | Cappelletti John D | $1,000,000 | |
| Previous Owner | Bagan James P | $999,000 | |
| Previous Owner | Bagan Catherine A | $787,500 | |
| Previous Owner | Bagan James P | $450,000 | |
| Closed | Bagan James P | $78,000 | |
| Closed | Bagan Catherine A | $90,000 |
Source: Public Records
Tax History Compared to Growth
Tax History
| Year | Tax Paid | Tax Assessment Tax Assessment Total Assessment is a certain percentage of the fair market value that is determined by local assessors to be the total taxable value of land and additions on the property. | Land | Improvement |
|---|---|---|---|---|
| 2025 | $22,439 | $1,796,558 | $1,205,804 | $590,754 |
| 2024 | $22,439 | $1,761,332 | $1,182,161 | $579,171 |
| 2023 | $22,040 | $1,726,797 | $1,158,982 | $567,815 |
| 2022 | $21,834 | $1,692,939 | $1,136,257 | $556,682 |
| 2021 | $21,410 | $1,659,745 | $1,113,978 | $545,767 |
| 2020 | $20,906 | $1,642,727 | $1,102,556 | $540,171 |
| 2019 | $20,457 | $1,610,518 | $1,080,938 | $529,580 |
| 2018 | $20,262 | $1,578,941 | $1,059,744 | $519,197 |
| 2017 | $20,106 | $1,547,982 | $1,038,965 | $509,017 |
| 2016 | $19,851 | $1,517,631 | $1,018,594 | $499,037 |
| 2015 | $19,741 | $1,494,835 | $1,003,294 | $491,541 |
| 2014 | $18,850 | $1,465,554 | $983,641 | $481,913 |
Source: Public Records
Map
Nearby Homes
- 1238 Wooded Hills Dr
- 1387 Hillcrest Dr
- 1256 Hillcrest Dr
- 1357 Box Canyon Rd
- 6746 Lookout Bend
- 7111 Echo Loop
- 6641 Leyland Park Dr
- 6824 Leyland Park Dr
- 1171 Wilhelmina Way
- 6638 Kettle Ct
- 6803 Lenwood Way
- 6628 Wildwood Ct
- 1140 Mallard Ridge Loop
- 6579 Cooperage Ct
- 6805 Almaden Rd
- 6570 Mcabee Rd
- 1101 Culligan Blvd
- 6605 Barnsdale Ct
- 1066 Quail Creek Cir
- 6407 Berwickshire Way
- 6813 Chateau Ct
- 1255 Olive Branch Ln
- 1251 Olive Branch Ln
- 6812 Chateau Ct
- 1259 Olive Branch Ln
- 6809 Chateau Ct
- 1258 Chateau Dr
- 1247 Olive Branch Ln
- 1254 Chateau Dr
- 6808 Chateau Ct
- 1262 Chateau Dr
- 1252 Chateau Dr
- 1232 Chateau Dr
- 1256 Olive Branch Ln
- 1252 Olive Branch Ln
- 1243 Olive Branch Ln
- 1226 Chateau Dr
- 1222 Chateau Dr Unit 2
- 1260 Olive Branch Ln
- 1240 Chateau Dr