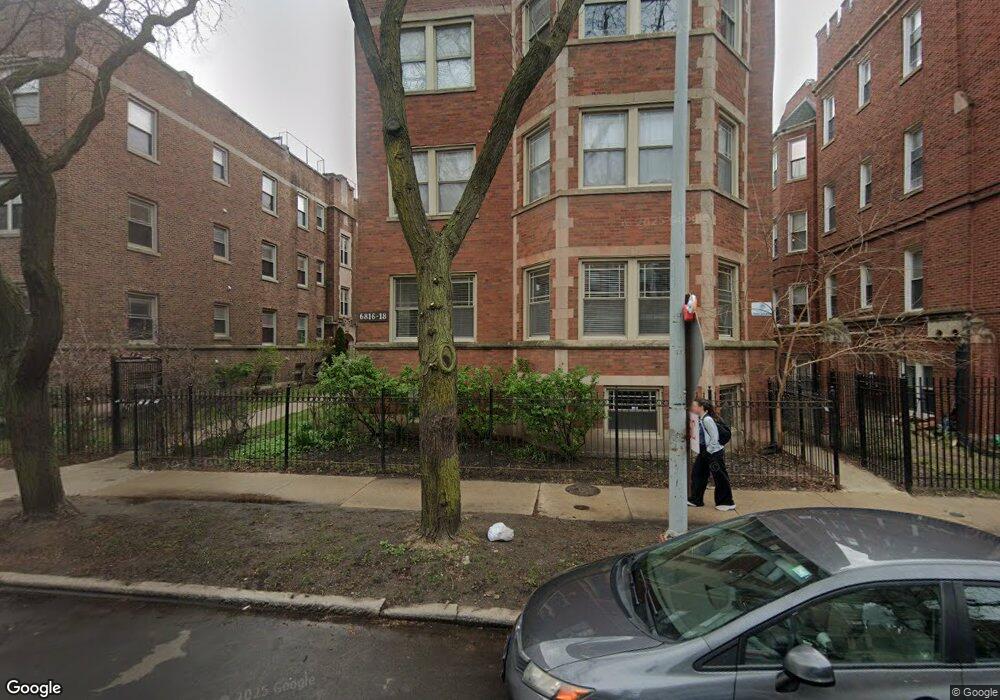
6816 N Ashland Blvd Unit 1B Chicago, IL 60626
Rogers Park NeighborhoodEstimated Value: $218,000 - $263,000
2
Beds
2
Baths
1,000
Sq Ft
$236/Sq Ft
Est. Value
About This Home
This home is located at 6816 N Ashland Blvd Unit 1B, Chicago, IL 60626 and is currently estimated at $236,419, approximately $236 per square foot. 6816 N Ashland Blvd Unit 1B is a home located in Cook County with nearby schools including Kilmer Elementary School, Sullivan High School, and Chicago Math and Science Academy.
Ownership History
Date
Name
Owned For
Owner Type
Purchase Details
Closed on
Jul 14, 2021
Sold by
Kozlowski Grzegorz
Bought by
Howe Jeff
Current Estimated Value
Home Financials for this Owner
Home Financials are based on the most recent Mortgage that was taken out on this home.
Original Mortgage
$128,000
Outstanding Balance
$116,955
Interest Rate
3.37%
Mortgage Type
New Conventional
Estimated Equity
$119,464
Purchase Details
Closed on
Mar 8, 2017
Sold by
Flagstar Bank Fsb
Bought by
Kozlowski Grzegorz
Home Financials for this Owner
Home Financials are based on the most recent Mortgage that was taken out on this home.
Original Mortgage
$84,800
Interest Rate
5.12%
Mortgage Type
New Conventional
Purchase Details
Closed on
Oct 4, 2007
Sold by
Davis Nancy D
Bought by
Davis Nancy D and Davis Leigh K
Purchase Details
Closed on
Jul 21, 2007
Sold by
6816-18 North Ashland Avenue Llc
Bought by
Davis Nancy D and Davis Leigh Kimball
Create a Home Valuation Report for This Property
The Home Valuation Report is an in-depth analysis detailing your home's value as well as a comparison with similar homes in the area
Home Values in the Area
Average Home Value in this Area
Purchase History
| Date | Buyer | Sale Price | Title Company |
|---|---|---|---|
| Howe Jeff | $160,000 | Baird & Warner Ttl Svcs Inc | |
| Kozlowski Grzegorz | $106,000 | Stewart Title | |
| Davis Nancy D | -- | Stewart Title Of Illinois | |
| Davis Nancy D | -- | None Available |
Source: Public Records
Mortgage History
| Date | Status | Borrower | Loan Amount |
|---|---|---|---|
| Open | Howe Jeff | $128,000 | |
| Previous Owner | Kozlowski Grzegorz | $84,800 |
Source: Public Records
Tax History Compared to Growth
Tax History
| Year | Tax Paid | Tax Assessment Tax Assessment Total Assessment is a certain percentage of the fair market value that is determined by local assessors to be the total taxable value of land and additions on the property. | Land | Improvement |
|---|---|---|---|---|
| 2024 | $3,376 | $20,484 | $1,131 | $19,353 |
| 2023 | $3,291 | $16,000 | $905 | $15,095 |
| 2022 | $3,291 | $16,000 | $905 | $15,095 |
| 2021 | $3,217 | $15,999 | $904 | $15,095 |
| 2020 | $2,010 | $9,021 | $728 | $8,293 |
| 2019 | $2,021 | $10,058 | $728 | $9,330 |
| 2018 | $1,987 | $10,058 | $728 | $9,330 |
| 2017 | $1,664 | $7,729 | $653 | $7,076 |
| 2016 | $1,548 | $7,729 | $653 | $7,076 |
| 2015 | $1,416 | $7,729 | $653 | $7,076 |
| 2014 | $1,797 | $9,686 | $603 | $9,083 |
| 2013 | $1,762 | $9,686 | $603 | $9,083 |
Source: Public Records
Map
Nearby Homes
- 6818 N Ashland Blvd Unit 1A
- 1643 W Farwell Ave Unit 3N
- 1657 W Farwell Ave Unit 1D
- 1515 W Pratt Blvd Unit 1
- 1630 W Columbia Ave Unit GN
- 1658 W Farwell Ave Unit GC
- 1627 W Columbia Ave Unit GW
- 1634 W Morse Ave Unit C
- 6737 N Greenview Ave Unit 2S
- 6753 N Hermitage Ave Unit 3B
- 6755 N Hermitage Ave Unit 1
- 6755 N Hermitage Ave Unit 2
- 6646 N Ashland Ave Unit 3
- 1411 W Farwell Ave Unit E2
- 6648 N Newgard Ave Unit 2
- 1745 W North Shore Ave
- 1749 W North Shore Ave
- 1629 W Greenleaf Ave Unit 407
- 6812 N Wayne Ave Unit 1G
- 6712 N Glenwood Ave Unit 2
- 6816 N Ashland Blvd Unit 3D
- 6816 N Ashland Blvd Unit 4D
- 6816 N Ashland Blvd Unit 3C
- 6816 N Ashland Blvd Unit 4C
- 6816 N Ashland Blvd Unit 2D
- 6816 N Ashland Blvd Unit 2C
- 6816 N Ashland Blvd Unit 1C
- 6816 N Ashland Blvd Unit 1A
- 6816 N Ashland Ave Unit 4D
- 6816 N Ashland Blvd Unit 3E
- 6816 N Ashland Ave Unit 1C
- 6816 N Ashland Ave Unit 3D
- 6818 N Ashland Blvd Unit 4B
- 6818 N Ashland Blvd Unit 1B
- 6818 N Ashland Blvd Unit 1
- 6818 N Ashland Blvd Unit 4A
- 6818 N Ashland Blvd Unit 4B
- 6818 N Ashland Blvd Unit 3B
- 6818 N Ashland Blvd Unit 3B
- 6818 N Ashland Blvd Unit 4B