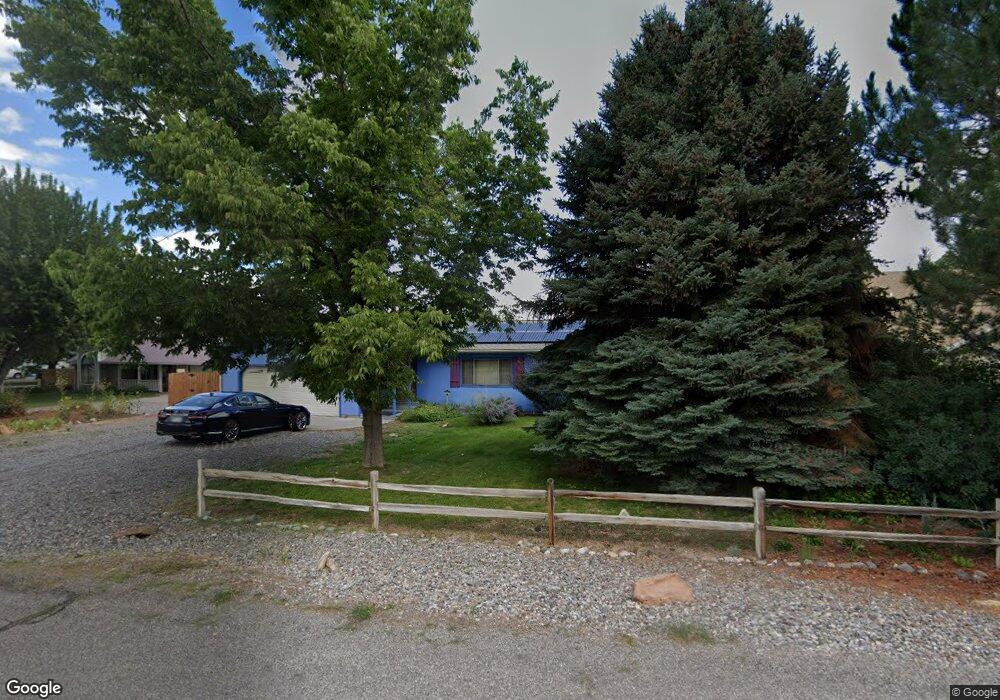
68172 Tumbleweed Rd Montrose, CO 81403
Estimated Value: $588,000 - $852,000
3
Beds
2
Baths
2,236
Sq Ft
$308/Sq Ft
Est. Value
About This Home
This home is located at 68172 Tumbleweed Rd, Montrose, CO 81403 and is currently estimated at $688,533, approximately $307 per square foot. 68172 Tumbleweed Rd is a home located in Montrose County with nearby schools including Cottonwood Elementary School, Centennial Middle School, and Montrose High School.
Ownership History
Date
Name
Owned For
Owner Type
Purchase Details
Closed on
Feb 10, 2015
Sold by
Brown Donald A
Bought by
Gwaltney William C and Gwaltney Janine L
Current Estimated Value
Purchase Details
Closed on
Jun 9, 1995
Sold by
Shand Jack A and Shand Genevieve D
Bought by
Brown Donald A and Brown Barbara A
Purchase Details
Closed on
May 29, 1987
Sold by
Reither Freece A and Reither Della J
Bought by
Shand Jack A and Shand Genevieve D
Purchase Details
Closed on
Jul 12, 1984
Sold by
Reither Freece A and Reither Della J
Bought by
Reither Freece A and Reither Della J
Purchase Details
Closed on
Jun 16, 1983
Sold by
Reither Freece A and Reither Della J
Bought by
Reither Freece A and Follman Richard
Purchase Details
Closed on
Apr 11, 1983
Sold by
Shinn Park Ranch
Bought by
Reither Freece A and Reither Della J
Purchase Details
Closed on
Aug 20, 1982
Sold by
Irwin J C J and Irwin Jack C
Bought by
Shinn Park Ranch
Create a Home Valuation Report for This Property
The Home Valuation Report is an in-depth analysis detailing your home's value as well as a comparison with similar homes in the area
Home Values in the Area
Average Home Value in this Area
Purchase History
| Date | Buyer | Sale Price | Title Company |
|---|---|---|---|
| Gwaltney William C | $234,500 | Land Title Guarantee | |
| Brown Donald A | $130,000 | -- | |
| Shand Jack A | $66,000 | -- | |
| Reither Freece A | -- | -- | |
| Reither Freece A | -- | -- | |
| Reither Freece A | $21,300 | -- | |
| Shinn Park Ranch | $203,000 | -- |
Source: Public Records
Tax History Compared to Growth
Tax History
| Year | Tax Paid | Tax Assessment Tax Assessment Total Assessment is a certain percentage of the fair market value that is determined by local assessors to be the total taxable value of land and additions on the property. | Land | Improvement |
|---|---|---|---|---|
| 2024 | $2,560 | $35,950 | $6,320 | $29,630 |
| 2023 | $2,560 | $41,120 | $7,230 | $33,890 |
| 2022 | $1,908 | $27,730 | $4,870 | $22,860 |
| 2021 | $1,967 | $28,530 | $5,010 | $23,520 |
| 2020 | $1,528 | $22,780 | $2,590 | $20,190 |
| 2019 | $1,538 | $22,780 | $2,590 | $20,190 |
| 2018 | $1,449 | $20,930 | $3,060 | $17,870 |
| 2017 | $1,437 | $20,930 | $3,060 | $17,870 |
| 2016 | $1,361 | $20,160 | $3,030 | $17,130 |
| 2015 | $1,337 | $20,160 | $3,030 | $17,130 |
| 2014 | $1,146 | $18,490 | $3,030 | $15,460 |
Source: Public Records
Map
Nearby Homes
- 68143 Tumbleweed Rd
- 20866 Trophy Rd
- 68053 Tumbleweed Rd
- Lot 49 6840 Rd
- Lot 43 6840 Rd
- Lot 50 6840 Rd
- Lot 48 6840 Rd
- 21179 Highway 550
- Lot 4 6785 Ct
- Lot 1 6785 Ct
- Lot 3 6785 Ct
- 20677 Tulip Cir
- 20547 Tulip Cir
- 21475 Highway 550
- 68200 Ute Valley Dr
- 21446 Uncompahgre Rd
- TBD Ute Valley Dr Unit Lot 1
- TBD Ute Valley Dr Unit Lot 2
- Lot 2 Trout Rd
- Lot 3 Trout Rd
- 68162 Tumbleweed Rd
- 68180 Tumbleweed Rd
- 68154 Tumbleweed Rd
- 0 Tumbleweed Rd
- 68177 Tumbleweed Rd
- 68146 Tumbleweed Rd
- 68140 Tumbleweed Rd
- 68151 Tumbleweed Rd
- 68195 Tumbleweed Rd
- 68200 Tumbleweed Rd
- 68135 Tumbleweed Rd
- 6915 Lane
- 20990 Trophy Rd
- 20950 Trophy Rd
- 20950 Trophy Rd Unit River's Edge Subdivi
- 0 Trophy Rd Unit 760143
- 0 Trophy Rd Unit 756252
- 0 Trophy Rd Unit 751953
- 0 Trophy Rd Unit 599573
- 0 Trophy Rd Unit 735433