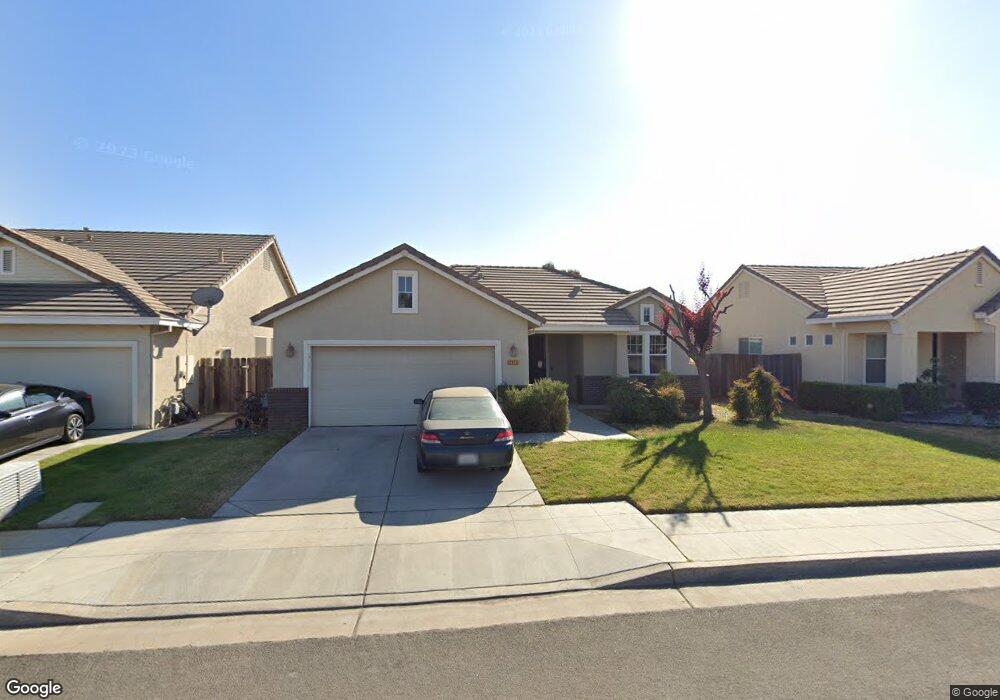
6819 E Montecito Ave Fresno, CA 93727
Sunnyside NeighborhoodEstimated Value: $386,000 - $420,229
3
Beds
3
Baths
1,533
Sq Ft
$267/Sq Ft
Est. Value
About This Home
This home is located at 6819 E Montecito Ave, Fresno, CA 93727 and is currently estimated at $408,743, approximately $266 per square foot. 6819 E Montecito Ave is a home located in Fresno County with nearby schools including John S. Wash Elementary School, Washington Academic Middle School, and Sanger High School.
Ownership History
Date
Name
Owned For
Owner Type
Purchase Details
Closed on
Jun 6, 2018
Sold by
Curiel Unice
Bought by
Her Chia and Vang Jensen
Current Estimated Value
Home Financials for this Owner
Home Financials are based on the most recent Mortgage that was taken out on this home.
Original Mortgage
$211,200
Outstanding Balance
$182,653
Interest Rate
4.5%
Mortgage Type
New Conventional
Estimated Equity
$226,090
Purchase Details
Closed on
Mar 8, 2016
Sold by
Clyde Patrick L and Clyde Courtney R
Bought by
Curiel Unice
Home Financials for this Owner
Home Financials are based on the most recent Mortgage that was taken out on this home.
Original Mortgage
$222,130
Interest Rate
3.62%
Mortgage Type
New Conventional
Purchase Details
Closed on
Jun 10, 2008
Sold by
Beazer Homes Holdings Corp
Bought by
Clyde Patrick L and Clyde Courtney R
Home Financials for this Owner
Home Financials are based on the most recent Mortgage that was taken out on this home.
Original Mortgage
$218,559
Interest Rate
5.99%
Mortgage Type
FHA
Create a Home Valuation Report for This Property
The Home Valuation Report is an in-depth analysis detailing your home's value as well as a comparison with similar homes in the area
Home Values in the Area
Average Home Value in this Area
Purchase History
| Date | Buyer | Sale Price | Title Company |
|---|---|---|---|
| Her Chia | $264,000 | Old Republic Title Company | |
| Curiel Unice | $229,000 | Placer Title Company | |
| Clyde Patrick L | $222,000 | Chicago Title Company |
Source: Public Records
Mortgage History
| Date | Status | Borrower | Loan Amount |
|---|---|---|---|
| Open | Her Chia | $211,200 | |
| Previous Owner | Curiel Unice | $222,130 | |
| Previous Owner | Clyde Patrick L | $218,559 |
Source: Public Records
Tax History
| Year | Tax Paid | Tax Assessment Tax Assessment Total Assessment is a certain percentage of the fair market value that is determined by local assessors to be the total taxable value of land and additions on the property. | Land | Improvement |
|---|---|---|---|---|
| 2025 | $4,397 | $300,380 | $90,113 | $210,267 |
| 2023 | $3,850 | $288,718 | $86,615 | $202,103 |
| 2022 | $3,770 | $283,058 | $84,917 | $198,141 |
| 2021 | $3,732 | $277,508 | $83,252 | $194,256 |
| 2020 | $3,617 | $274,664 | $82,399 | $192,265 |
| 2019 | $3,591 | $269,280 | $80,784 | $188,496 |
| 2018 | $3,158 | $238,251 | $71,475 | $166,776 |
| 2017 | $3,042 | $233,580 | $70,074 | $163,506 |
| 2016 | $2,506 | $200,000 | $50,000 | $150,000 |
| 2015 | $2,632 | $195,000 | $45,000 | $150,000 |
| 2014 | $2,470 | $178,700 | $48,200 | $130,500 |
Source: Public Records
Map
Nearby Homes
- 284 S Temperance Ave
- 6525 E Raco Ave
- 6591 E Liberty Ave
- 7176 E Butler Ave
- 6954 E Braly Ave
- 6575 E Cetti Ave
- 944 S Clover Ave
- 6693 E Nevada Ave
- 7581 E Kings Canyon Rd
- 672 N Apricot Ave
- 6165 E Heaton Ave
- 6330 E Creek View Ln
- 6035 E Lyell Ave
- 6290 E Creek View Ln
- 6349 E Braly Ave
- 6280 E Valley Edge Dr
- 6310 E Woodward Ave
- 3333 E Tulare St
- 6672 E Washington Ave
- 833 S Stanford Ave
- 6803 E Montecito Ave
- 6835 E Montecito Ave
- 6820 E Alta Ave
- 6787 E Montecito Ave
- 6804 E Alta Ave
- 6836 E Alta Ave
- 6851 E Montecito Ave
- 6788 E Alta Ave
- 6852 E Alta Ave
- 6771 E Montecito Ave
- 6772 E Alta Ave
- 6868 E Alta Ave
- 6755 E Montecito Ave
- 6817 E Alta Ave
- 6801 E Alta Ave
- 6756 E Alta Ave
- 6833 E Alta Ave
- 6899 E Montecito Ave
- 6785 E Alta Ave
- 6849 E Alta Ave
Your Personal Tour Guide
Ask me questions while you tour the home.