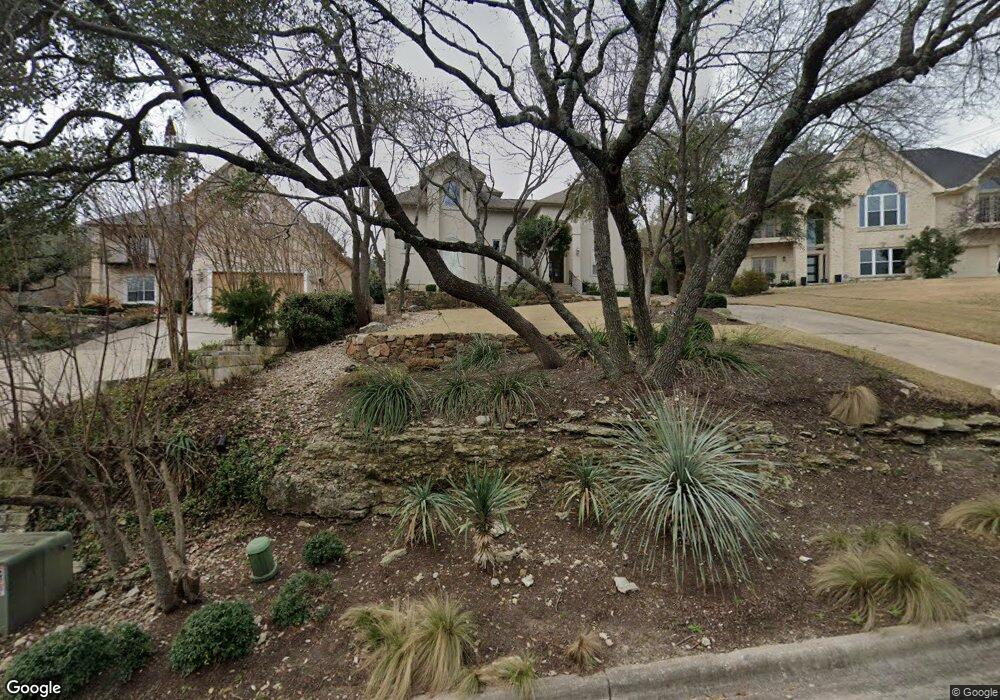
6819 Finklea Cove Austin, TX 78730
Shepherd Mountain NeighborhoodEstimated Value: $1,353,937 - $1,742,000
--
Bed
4
Baths
3,787
Sq Ft
$427/Sq Ft
Est. Value
About This Home
This home is located at 6819 Finklea Cove, Austin, TX 78730 and is currently estimated at $1,618,484, approximately $427 per square foot. 6819 Finklea Cove is a home located in Travis County with nearby schools including Highland Park Elementary School, Lamar Middle School, and McCallum High School.
Ownership History
Date
Name
Owned For
Owner Type
Purchase Details
Closed on
Mar 8, 2002
Sold by
Harrington Custom Homes Inc
Bought by
Patch Todd Michael and Patch Kerry K
Current Estimated Value
Home Financials for this Owner
Home Financials are based on the most recent Mortgage that was taken out on this home.
Original Mortgage
$420,000
Outstanding Balance
$173,840
Interest Rate
6.93%
Mortgage Type
Purchase Money Mortgage
Estimated Equity
$1,444,644
Purchase Details
Closed on
Nov 30, 2000
Sold by
Cca Construction Partners Lp
Bought by
Chase Marc G
Home Financials for this Owner
Home Financials are based on the most recent Mortgage that was taken out on this home.
Original Mortgage
$584,500
Interest Rate
7.84%
Mortgage Type
Purchase Money Mortgage
Purchase Details
Closed on
Mar 6, 2000
Sold by
Whittenburg James S and Whittenburg Julie E
Bought by
Cca Construction Lp
Purchase Details
Closed on
Jul 9, 1998
Sold by
Roper Acquisitions Ltd
Bought by
Whittenburg James S and Whittenburg Julie E
Home Financials for this Owner
Home Financials are based on the most recent Mortgage that was taken out on this home.
Original Mortgage
$72,900
Interest Rate
7.09%
Mortgage Type
Purchase Money Mortgage
Create a Home Valuation Report for This Property
The Home Valuation Report is an in-depth analysis detailing your home's value as well as a comparison with similar homes in the area
Home Values in the Area
Average Home Value in this Area
Purchase History
| Date | Buyer | Sale Price | Title Company |
|---|---|---|---|
| Patch Todd Michael | -- | -- | |
| Harrington Custom Homes Inc | -- | Heritage Title | |
| Chase Marc G | -- | -- | |
| Cca Construction Lp | -- | Fidelity National Title | |
| Whittenburg James S | -- | -- |
Source: Public Records
Mortgage History
| Date | Status | Borrower | Loan Amount |
|---|---|---|---|
| Open | Patch Todd Michael | $420,000 | |
| Previous Owner | Chase Marc G | $584,500 | |
| Previous Owner | Whittenburg James S | $72,900 | |
| Closed | Cca Construction Lp | $0 |
Source: Public Records
Tax History Compared to Growth
Tax History
| Year | Tax Paid | Tax Assessment Tax Assessment Total Assessment is a certain percentage of the fair market value that is determined by local assessors to be the total taxable value of land and additions on the property. | Land | Improvement |
|---|---|---|---|---|
| 2025 | $19,885 | $1,206,738 | $526,344 | $680,394 |
| 2023 | $16,428 | $1,055,371 | $0 | $0 |
| 2022 | $18,948 | $959,428 | $0 | $0 |
| 2021 | $18,985 | $872,207 | $250,000 | $854,100 |
| 2020 | $17,007 | $792,915 | $250,000 | $542,915 |
| 2018 | $16,367 | $739,245 | $250,000 | $505,889 |
| 2017 | $14,987 | $672,041 | $250,000 | $589,301 |
| 2016 | $13,625 | $610,946 | $250,000 | $501,383 |
| 2015 | $11,239 | $555,405 | $250,000 | $530,022 |
| 2014 | $11,239 | $504,914 | $0 | $0 |
Source: Public Records
Map
Nearby Homes
- 6801 Finklea Cove
- 6607 W Courtyard Dr
- 6505 W Courtyard Dr
- 5525 City Park Rd
- 6000 Shepherd Mountain Cove Unit 1805
- 6000 Shepherd Mountain Cove Unit 107
- 6000 Shepherd Mountain Cove Unit 2103
- 6000 Shepherd Mountain Cove Unit 503
- 6000 Shepherd Mountain Cove Unit 1904
- 6000 Shepherd Mountain Cove Unit 613
- 6000 Shepherd Mountain Cove Unit 915
- 6000 Shepherd Mountain Cove Unit 2202
- 6000 Shepherd Mountain Cove Unit 407
- 6000 Shepherd Mountain Cove Unit 302
- 6000 Shepherd Mountain Cove Unit 1917
- 6000 Shepherd Mountain Cove Unit 807
- 6000 Shepherd Mountain Cove Unit 1202
- 6000 Shepherd Mountain Cove Unit 1413
- 6507 Bridge Point Pkwy Unit LVS Gardenia 2B
- 6507 Bridge Point Pkwy Unit Lot 7
- 6817 Finklea Cove
- 6901 Finklea Cove
- 5806 Kaelan Cove
- 6942 W Courtyard Dr
- 6900 Finklea Cove
- 6820 Finklea Cove
- 5802 Kaelan Cove
- 6816 Finklea Cove
- 5805 Kaelan Cove
- 5800 Kaelan Cove
- 5803 Kaelan Cove
- 5801 Kaelan Cove
- 6807 Finklea Cove
- 6804 Finklea Cove
- 6805 Finklea Cove
- 5807 City Park Rd Unit 5
- 5807 City Park Rd Unit 9
- 5807 City Park Rd Unit 3
- 5807 City Park Rd Unit 8
- 5807 City Park Rd Unit 14