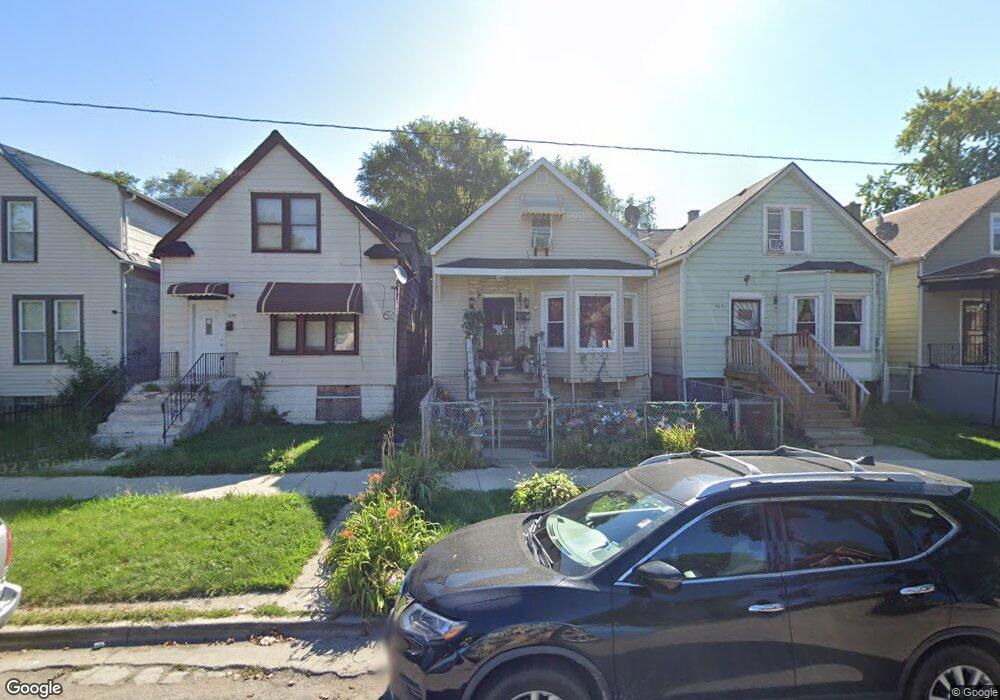
6819 S Marshfield Ave Chicago, IL 60636
Englewood NeighborhoodEstimated Value: $78,296 - $179,000
4
Beds
1
Bath
924
Sq Ft
$130/Sq Ft
Est. Value
About This Home
This home is located at 6819 S Marshfield Ave, Chicago, IL 60636 and is currently estimated at $119,824, approximately $129 per square foot. 6819 S Marshfield Ave is a home located in Cook County with nearby schools including O'Toole Elementary School, The Montessori School of Englewood Charter School, and Providence-Englewood Elementary Charter School.
Ownership History
Date
Name
Owned For
Owner Type
Purchase Details
Closed on
Dec 29, 2021
Sold by
Bayless Christopher L and Bayless Tina
Bought by
White Lorraine
Current Estimated Value
Purchase Details
Closed on
Apr 1, 2001
Sold by
Lewkewicz K Ken and Ruzevich Joseph M
Bought by
Bayless Christopher L
Home Financials for this Owner
Home Financials are based on the most recent Mortgage that was taken out on this home.
Original Mortgage
$80,900
Interest Rate
7.05%
Purchase Details
Closed on
Jan 8, 2001
Sold by
Bank One National Assn
Bought by
Lewkowicz K Ken and Ruzevich Joseph M
Purchase Details
Closed on
May 10, 2000
Sold by
Milon Jimmie
Bought by
Bank One National Assn and First National Bank Of Chicago
Purchase Details
Closed on
Mar 22, 1999
Sold by
Milon Olliphine
Bought by
Milon Jimmie
Home Financials for this Owner
Home Financials are based on the most recent Mortgage that was taken out on this home.
Original Mortgage
$51,000
Interest Rate
12.1%
Create a Home Valuation Report for This Property
The Home Valuation Report is an in-depth analysis detailing your home's value as well as a comparison with similar homes in the area
Home Values in the Area
Average Home Value in this Area
Purchase History
| Date | Buyer | Sale Price | Title Company |
|---|---|---|---|
| White Lorraine | $1,000 | -- | |
| White Lorraine | $1,000 | -- | |
| Bayless Christopher L | $90,000 | First American Title | |
| Lewkowicz K Ken | $30,000 | -- | |
| Bank One National Assn | -- | -- | |
| Milon Jimmie | $42,000 | -- |
Source: Public Records
Mortgage History
| Date | Status | Borrower | Loan Amount |
|---|---|---|---|
| Previous Owner | Bayless Christopher L | $80,900 | |
| Previous Owner | Milon Jimmie | $51,000 |
Source: Public Records
Tax History Compared to Growth
Tax History
| Year | Tax Paid | Tax Assessment Tax Assessment Total Assessment is a certain percentage of the fair market value that is determined by local assessors to be the total taxable value of land and additions on the property. | Land | Improvement |
|---|---|---|---|---|
| 2024 | $677 | $5,601 | $938 | $4,663 |
| 2023 | $677 | $3,293 | $2,031 | $1,262 |
| 2022 | $677 | $3,293 | $2,031 | $1,262 |
| 2021 | $1,086 | $3,293 | $2,031 | $1,262 |
| 2020 | $1,086 | $4,876 | $2,343 | $2,533 |
| 2019 | $1,089 | $5,418 | $2,343 | $3,075 |
| 2018 | $1,070 | $5,418 | $2,343 | $3,075 |
| 2017 | $1,623 | $7,538 | $2,031 | $5,507 |
| 2016 | $1,510 | $7,538 | $2,031 | $5,507 |
| 2015 | $1,381 | $7,538 | $2,031 | $5,507 |
| 2014 | $1,326 | $7,147 | $1,875 | $5,272 |
| 2013 | $1,300 | $7,147 | $1,875 | $5,272 |
Source: Public Records
Map
Nearby Homes
- 6819 S Ashland Ave
- 6807 S Paulina St
- 1624 W 69th St
- 6725 S Justine St
- 6812 S Hermitage Ave
- 6805 S Wood St
- 1507 W Marquette Rd
- 6832 S Bishop St
- 6627 S Marshfield Ave
- 6817 S Bishop St
- 1638 W Marquette Rd
- 7002 S Paulina St
- 6841 S Bishop St
- 7010 S Paulina St
- 6715 S Bishop St
- 7017 S Hermitage Ave
- 5943 S Marshfield Ave
- 6830 S Honore St
- 7015 S Wood St
- 5954 S Ashland Ave
- 6817 S Marshfield Ave
- 6815 S Marshfield Ave
- 6821 S Marshfield Ave
- 6809 S Marshfield Ave
- 6823 S Marshfield Ave
- 6807 S Marshfield Ave
- 6827 S Marshfield Ave
- 6818-20 S Ashland Ave
- 6829 S Marshfield Ave
- 6816 S Ashland Ave Unit 3B
- 6816 S Ashland Ave Unit 2B
- 6816 S Ashland Ave Unit 4A
- 6816 S Ashland Ave Unit 2A
- 6816 S Ashland Ave Unit 4B
- 6816 S Ashland Ave Unit 3A
- 6818 S Ashland Ave
- 6801 S Marshfield Ave
- 6820 S Ashland Ave
- 6835 S Marshfield Ave
- 6814 S Marshfield Ave