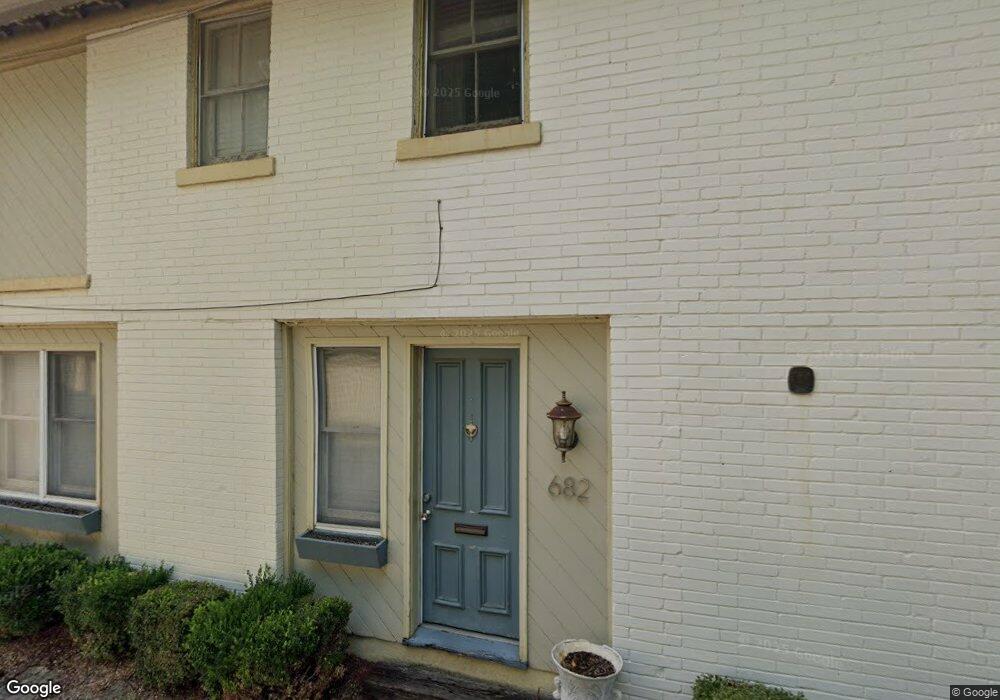
682 Macon Alley Unit 684 Columbus, OH 43206
German Village NeighborhoodEstimated Value: $824,000 - $1,222,000
10
Beds
4
Baths
4,964
Sq Ft
$204/Sq Ft
Est. Value
About This Home
This home is located at 682 Macon Alley Unit 684, Columbus, OH 43206 and is currently estimated at $1,013,180, approximately $204 per square foot. 682 Macon Alley Unit 684 is a home located in Franklin County with nearby schools including Siebert Elementary School, South High School, and South Columbus Preparatory Academy.
Ownership History
Date
Name
Owned For
Owner Type
Purchase Details
Closed on
May 9, 2003
Sold by
Wilkins Becky T and Wilkins Douglas E
Bought by
187-189 Sycamore St Llc
Current Estimated Value
Home Financials for this Owner
Home Financials are based on the most recent Mortgage that was taken out on this home.
Original Mortgage
$365,000
Interest Rate
5.95%
Mortgage Type
Purchase Money Mortgage
Purchase Details
Closed on
Aug 17, 1999
Sold by
Holdridge Fred J and Burns Howard W
Bought by
Wilkins Becky T
Home Financials for this Owner
Home Financials are based on the most recent Mortgage that was taken out on this home.
Original Mortgage
$180,000
Interest Rate
7.7%
Purchase Details
Closed on
May 27, 1976
Bought by
Burns Howard W
Create a Home Valuation Report for This Property
The Home Valuation Report is an in-depth analysis detailing your home's value as well as a comparison with similar homes in the area
Home Values in the Area
Average Home Value in this Area
Purchase History
| Date | Buyer | Sale Price | Title Company |
|---|---|---|---|
| 187-189 Sycamore St Llc | $430,000 | The Title Company Ltd | |
| Wilkins Becky T | $360,000 | Landsel Title Agency | |
| Burns Howard W | -- | -- |
Source: Public Records
Mortgage History
| Date | Status | Borrower | Loan Amount |
|---|---|---|---|
| Closed | 187-189 Sycamore St Llc | $365,000 | |
| Previous Owner | Wilkins Becky T | $180,000 |
Source: Public Records
Tax History Compared to Growth
Tax History
| Year | Tax Paid | Tax Assessment Tax Assessment Total Assessment is a certain percentage of the fair market value that is determined by local assessors to be the total taxable value of land and additions on the property. | Land | Improvement |
|---|---|---|---|---|
| 2024 | $14,082 | $307,270 | $136,150 | $171,120 |
| 2023 | $13,906 | $307,265 | $136,150 | $171,115 |
| 2022 | $12,820 | $241,230 | $74,380 | $166,850 |
| 2021 | $12,843 | $241,230 | $74,380 | $166,850 |
| 2020 | $12,862 | $241,230 | $74,380 | $166,850 |
| 2019 | $13,043 | $209,760 | $64,680 | $145,080 |
| 2018 | $11,829 | $209,760 | $64,680 | $145,080 |
| 2017 | $12,361 | $209,760 | $64,680 | $145,080 |
| 2016 | $11,683 | $171,960 | $52,400 | $119,560 |
| 2015 | $10,636 | $171,960 | $52,400 | $119,560 |
| 2014 | $10,662 | $171,960 | $52,400 | $119,560 |
| 2013 | $5,008 | $163,765 | $49,910 | $113,855 |
Source: Public Records
Map
Nearby Homes
- 649 S 5th St
- 688 S 5th St
- 133 E Sycamore St
- 606 Rader Alley
- 278 E Sycamore St
- 279-281 E Beck St
- 745 Mohawk St
- 718 S 6th St
- 161 Jackson St
- 639 S Grant Ave
- 307 E Sycamore St
- 717 S 3rd St
- 628 S Grant Ave
- 783 Mohawk St
- 300 Jackson St
- 318 Berger Alley
- 335 E Beck St Unit 337
- 707 Sycamore Place Unit 707
- 169 E Livingston Ave
- 616 S Grant Ave Unit 3B
- 193 E Sycamore St
- 195 E Sycamore St
- 199 E Sycamore St
- 683 Macon Alley Unit 685
- 181 E Sycamore St
- 201 E Sycamore St
- 676 Mohawk St Unit 678
- 183 Alexander Alley
- 203 E Sycamore St
- 670 Mohawk St Unit 672
- 173 E Sycamore St
- 688 Mohawk St
- 178 Alexander Alley
- 659 S 5th St
- 684 Mohawk St
- 697 S 5th St
- 186 E Sycamore St
- 703 S 5th St
- 692 Mohawk St
- 200 E Sycamore St