682 Serenity Pointe Ashland, NE 68003
Estimated Value: $931,000 - $1,212,000
--
Bed
--
Bath
2,155
Sq Ft
$492/Sq Ft
Est. Value
About This Home
This home is located at 682 Serenity Pointe, Ashland, NE 68003 and is currently estimated at $1,060,757, approximately $492 per square foot. 682 Serenity Pointe is a home with nearby schools including Ashland-Greenwood Elementary School, Ashland-Greenwood Middle School, and Ashland-Greenwood High School.
Ownership History
Date
Name
Owned For
Owner Type
Purchase Details
Closed on
Jul 31, 2023
Sold by
Troyer Landon L
Bought by
Landon L Troyer Trust and Troyer
Current Estimated Value
Purchase Details
Closed on
Mar 18, 2021
Sold by
Sedlacek Megan
Bought by
Troyer Landon
Purchase Details
Closed on
May 7, 2020
Sold by
Troyer Landon and Troyer Megan
Bought by
Troyer Landon and Troyer Megan
Purchase Details
Closed on
Jul 28, 2017
Sold by
Johnson Matthew E and Johnson Kacey
Bought by
Troyer Landon and Sedlacek Megan
Home Financials for this Owner
Home Financials are based on the most recent Mortgage that was taken out on this home.
Original Mortgage
$496,000
Interest Rate
3.9%
Mortgage Type
Construction
Purchase Details
Closed on
Jul 23, 2014
Bought by
Johnson Matthew E
Create a Home Valuation Report for This Property
The Home Valuation Report is an in-depth analysis detailing your home's value as well as a comparison with similar homes in the area
Home Values in the Area
Average Home Value in this Area
Purchase History
| Date | Buyer | Sale Price | Title Company |
|---|---|---|---|
| Landon L Troyer Trust | -- | None Listed On Document | |
| Landon L Troyer Trust | -- | None Listed On Document | |
| Troyer Landon | -- | None Available | |
| Troyer Landon | -- | None Available | |
| Troyer Landon | $185,000 | Ambassador Title | |
| Johnson Matthew E | -- | Title Services Of The Plains |
Source: Public Records
Mortgage History
| Date | Status | Borrower | Loan Amount |
|---|---|---|---|
| Previous Owner | Troyer Landon | $496,000 |
Source: Public Records
Tax History Compared to Growth
Tax History
| Year | Tax Paid | Tax Assessment Tax Assessment Total Assessment is a certain percentage of the fair market value that is determined by local assessors to be the total taxable value of land and additions on the property. | Land | Improvement |
|---|---|---|---|---|
| 2024 | $7,495 | $842,819 | $140,000 | $702,819 |
| 2023 | $9,177 | $767,757 | $140,000 | $627,757 |
| 2022 | $9,918 | $767,757 | $140,000 | $627,757 |
| 2021 | $7,494 | $587,242 | $140,000 | $447,242 |
| 2020 | $7,486 | $587,242 | $140,000 | $447,242 |
| 2019 | $7,990 | $587,242 | $140,000 | $447,242 |
| 2018 | $2,186 | $158,040 | $140,000 | $18,040 |
| 2017 | $1,976 | $140,000 | $140,000 | $0 |
| 2016 | $1,761 | $125,000 | $125,000 | $0 |
| 2015 | $1,832 | $125,000 | $125,000 | $0 |
| 2014 | $898 | $60,000 | $60,000 | $0 |
Source: Public Records
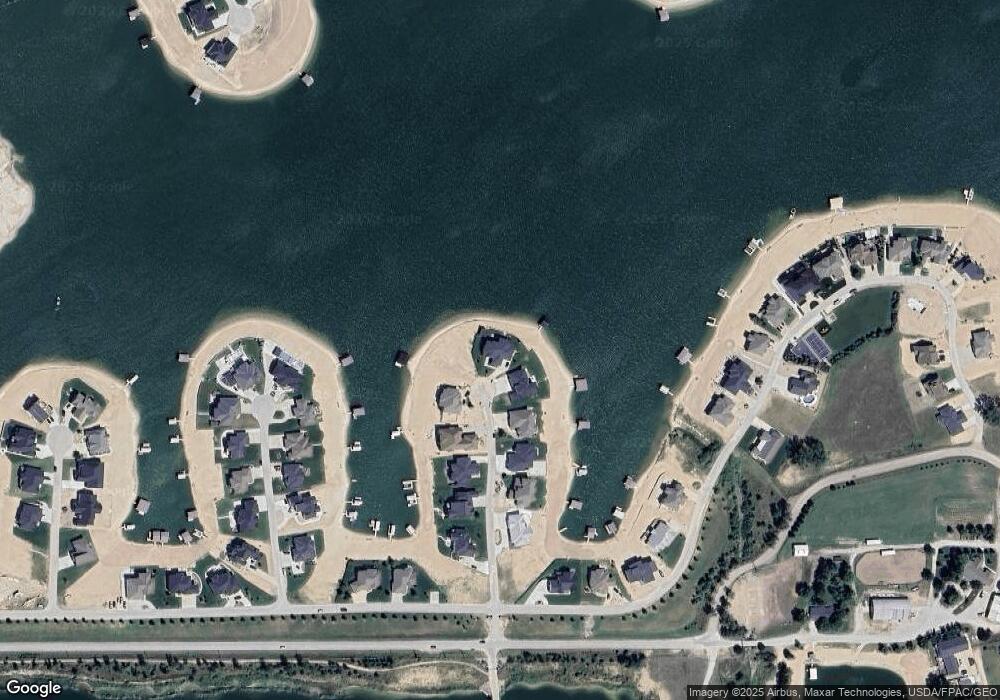
Map
Nearby Homes
- 314 Driftwood Ln
- 676 Waterford Pointe
- 335 S Marina Way
- 723 Firestone Pointe
- 747 Stonewood Pointe
- 734 Cobblestone Pointe
- 716 Timberstone Dr
- 336 N Marina Way
- 660 Red Tail Ln
- 633 Cottonwood Cir
- 627 Kingfisher Cir
- 1075 Wann Rd
- 872 Big Wake Point
- 0 County Road 5
- 380 County Road F
- 451 County Road B
- 1007 Bluejay Cir
- 725 Courtyard Ct
- 2214 Bluejay Way
- 2202 Bluejay Way
- 680 Serenity Pointe
- 681 Serenity Pointe
- 679 Serenity Pointe
- 678 Serenity Pointe
- 677 Serenity Pointe
- 676 Serenity Pointe
- 675 Serenity Pointe
- 674 Serenity Pointe
- Lot 17 Serenity Pointe
- Lot 15 Serenity Pointe
- Lot 14 Serenity Pointe
- Lot 13 Serenity Pointe
- Lot 12 Serenity Pointe
- Lot 19 Serenity Pointe
- Lot 18 Serenity Pointe
- 673 Serenity Pointe
- 672 Serenity Pointe
- 672 Serenity Pointe
- 671 Serenity Pointe Unit lot 19
- 671 Serenity Pointe