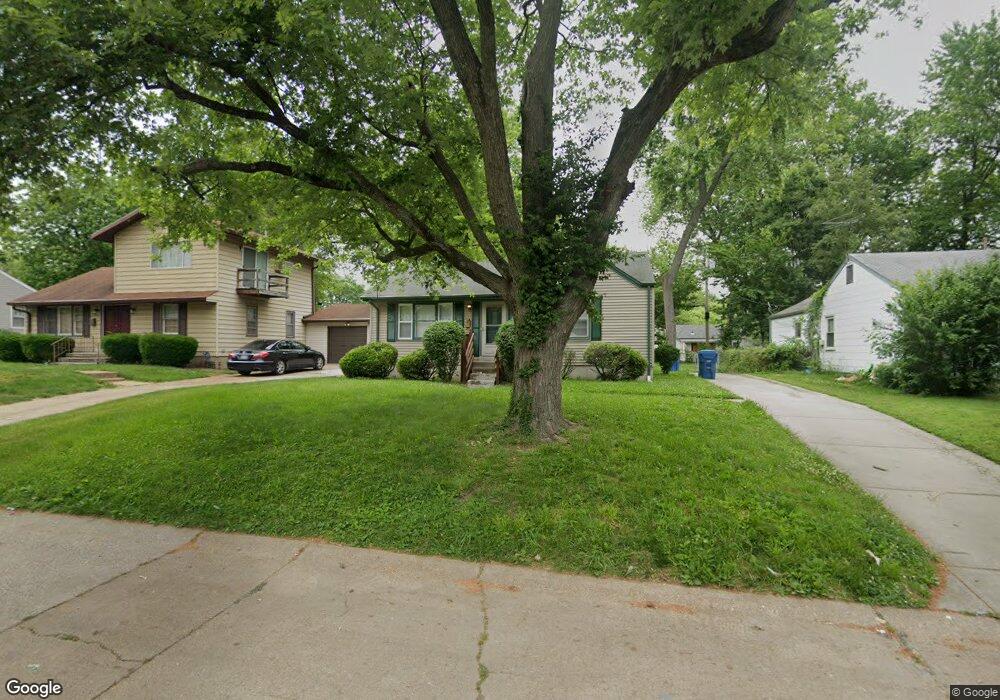
6820 Brower Ct Saint Louis, MO 63134
Estimated Value: $81,000 - $105,000
3
Beds
1
Bath
840
Sq Ft
$110/Sq Ft
Est. Value
About This Home
This home is located at 6820 Brower Ct, Saint Louis, MO 63134 and is currently estimated at $92,002, approximately $109 per square foot. 6820 Brower Ct is a home located in St. Louis County with nearby schools including Walnut Grove Elementary School, Ferguson Middle School, and McCluer High School.
Ownership History
Date
Name
Owned For
Owner Type
Purchase Details
Closed on
Feb 15, 2011
Sold by
Secretary Of Housing & Urban Development
Bought by
Mahr Garrett L
Current Estimated Value
Purchase Details
Closed on
Feb 17, 2010
Sold by
Cornell Deborah E
Bought by
Bac Home Loans Servicing Lp and Countrywide Home Loans Servicing Lp
Purchase Details
Closed on
Jul 26, 2002
Sold by
Sills Barbara
Bought by
Cornell Deborah E
Home Financials for this Owner
Home Financials are based on the most recent Mortgage that was taken out on this home.
Original Mortgage
$56,118
Interest Rate
6.53%
Mortgage Type
FHA
Purchase Details
Closed on
May 27, 1998
Sold by
Wiener Jeffrey A and Wiener Beverly A
Bought by
Sills Barbara
Home Financials for this Owner
Home Financials are based on the most recent Mortgage that was taken out on this home.
Original Mortgage
$46,500
Interest Rate
6.95%
Create a Home Valuation Report for This Property
The Home Valuation Report is an in-depth analysis detailing your home's value as well as a comparison with similar homes in the area
Home Values in the Area
Average Home Value in this Area
Purchase History
| Date | Buyer | Sale Price | Title Company |
|---|---|---|---|
| Mahr Garrett L | $20,300 | Northwest Title Agency | |
| Bac Home Loans Servicing Lp | $62,254 | None Available | |
| Secretary Of Housing & Urban Development | -- | None Available | |
| Cornell Deborah E | $56,999 | -- | |
| Sills Barbara | -- | -- |
Source: Public Records
Mortgage History
| Date | Status | Borrower | Loan Amount |
|---|---|---|---|
| Previous Owner | Cornell Deborah E | $56,118 | |
| Previous Owner | Sills Barbara | $46,500 | |
| Closed | Sills Barbara | $2,000 |
Source: Public Records
Tax History Compared to Growth
Tax History
| Year | Tax Paid | Tax Assessment Tax Assessment Total Assessment is a certain percentage of the fair market value that is determined by local assessors to be the total taxable value of land and additions on the property. | Land | Improvement |
|---|---|---|---|---|
| 2025 | $943 | $16,380 | $2,000 | $14,380 |
| 2024 | $943 | $12,180 | $1,600 | $10,580 |
| 2023 | $943 | $12,180 | $1,600 | $10,580 |
| 2022 | $719 | $8,140 | $1,200 | $6,940 |
| 2021 | $714 | $8,140 | $1,200 | $6,940 |
| 2020 | $741 | $7,880 | $1,630 | $6,250 |
| 2019 | $710 | $7,880 | $1,630 | $6,250 |
| 2018 | $511 | $5,030 | $1,290 | $3,740 |
| 2017 | $507 | $5,030 | $1,290 | $3,740 |
| 2016 | $525 | $5,030 | $1,670 | $3,360 |
| 2015 | $510 | $5,030 | $1,670 | $3,360 |
| 2014 | $1,011 | $10,230 | $1,810 | $8,420 |
Source: Public Records
Map
Nearby Homes
- 8293 Frost Ave
- 230 Anistasia Dr
- 8401 Saint Olaf Dr
- 217 Anistasia Dr
- 6621 Dunwold Dr
- 8354 Latty Ave
- 6812 Saint Olaf Dr
- 6605 Carol Lee Dr
- 6637 Torlina Dr
- 6717 Thurston Ave
- 8501 Frost Ave
- 7040 Clover Ln
- 135 Grether Ave
- 6612 Torlina Dr
- 110 Young Dr
- 8413 January Ave
- 135 Anistasia Dr
- 6706 Alder Ave
- 13 Cady Dr
- 515 Marechal Ln