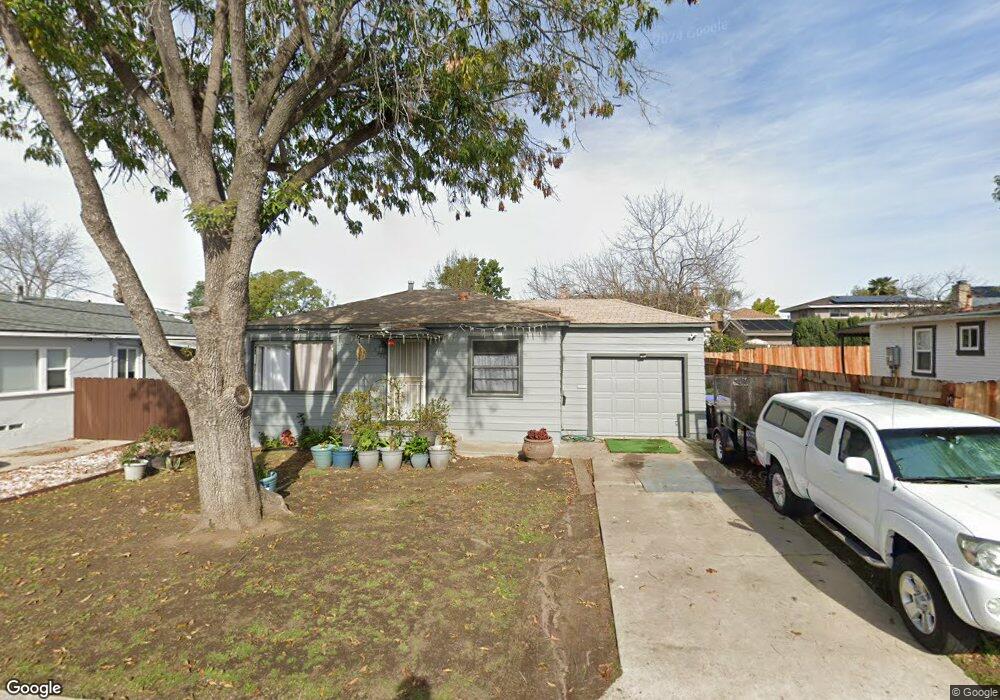
6820 Tower St La Mesa, CA 91942
5
Beds
3
Baths
2,148
Sq Ft
--
Built
About This Home
This home is located at 6820 Tower St, La Mesa, CA 91942. 6820 Tower St is a home located in San Diego County with nearby schools including Rolando Elementary School, La Mesa Arts Academy, and Mount Miguel High School.
Create a Home Valuation Report for This Property
The Home Valuation Report is an in-depth analysis detailing your home's value as well as a comparison with similar homes in the area
Tax History
| Year | Tax Paid | Tax Assessment Tax Assessment Total Assessment is a certain percentage of the fair market value that is determined by local assessors to be the total taxable value of land and additions on the property. | Land | Improvement |
|---|---|---|---|---|
| 2025 | $4,636 | $322,361 | $125,404 | $196,957 |
| 2024 | $4,636 | $316,042 | $122,946 | $193,096 |
| 2023 | $4,557 | $309,846 | $120,536 | $189,310 |
| 2022 | $4,547 | $303,772 | $118,173 | $185,599 |
| 2021 | $4,497 | $297,816 | $115,856 | $181,960 |
| 2020 | $4,327 | $294,764 | $114,669 | $180,095 |
| 2019 | $4,268 | $288,985 | $112,421 | $176,564 |
| 2018 | $4,200 | $283,319 | $110,217 | $173,102 |
| 2017 | $50 | $277,764 | $108,056 | $169,708 |
| 2016 | $4,054 | $272,319 | $105,938 | $166,381 |
| 2015 | $4,049 | $268,229 | $104,347 | $163,882 |
| 2014 | $3,953 | $262,975 | $102,303 | $160,672 |
Source: Public Records
Map
Nearby Homes
- 4557 Toni Ln
- 6850 Rosefield Dr
- 6969 Tower St
- 4844 68th St Unit 3
- 4790 70th St Unit 6
- 4623 Alamo Dr
- 6927 Amherst St Unit 3
- 6927 Amherst St Unit 1
- 4796 Valencia Dr
- 6979-81 Amherst St
- 4350 68th St
- 4445 Mataro Dr
- 7105 Amherst St
- 4635 Mataro Dr
- 7118 Stanford Ave
- 6650 Vigo Dr
- 4775 Seminole Dr Unit 201
- 4777 Seminole Dr Unit 118
- 4860 Rolando Ct Unit 52
- 4860 Rolando Ct Unit 81
Your Personal Tour Guide
Ask me questions while you tour the home.