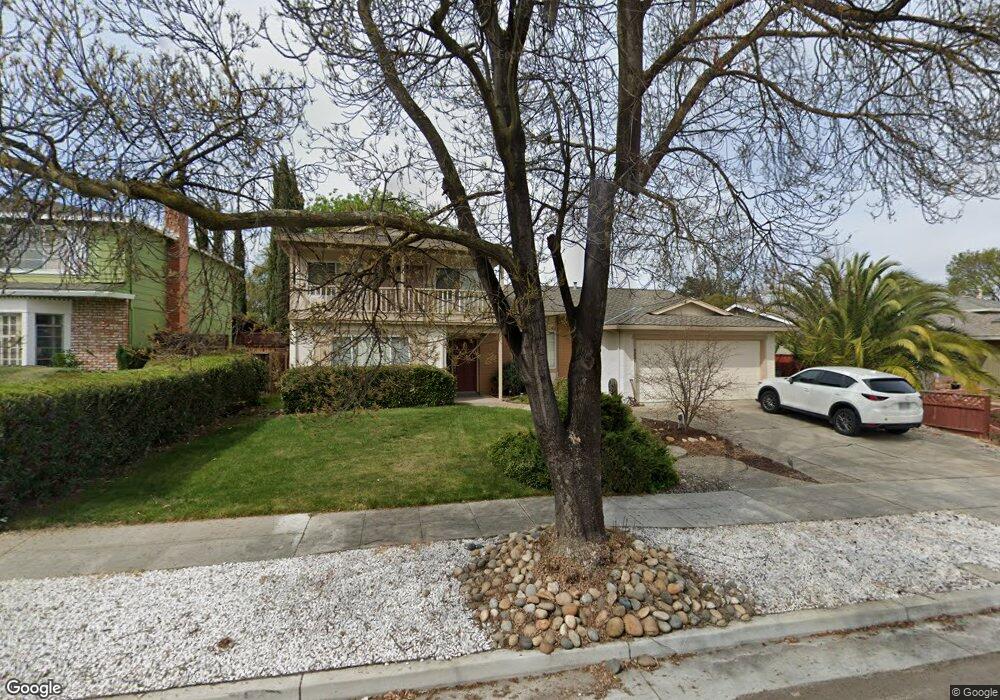
6820 Trinidad Dr San Jose, CA 95120
Shadow Brook I NeighborhoodEstimated Value: $2,339,000 - $2,580,000
4
Beds
3
Baths
2,214
Sq Ft
$1,089/Sq Ft
Est. Value
About This Home
This home is located at 6820 Trinidad Dr, San Jose, CA 95120 and is currently estimated at $2,411,738, approximately $1,089 per square foot. 6820 Trinidad Dr is a home located in Santa Clara County with nearby schools including Graystone Elementary School, Bret Harte Middle School, and Leland High School.
Ownership History
Date
Name
Owned For
Owner Type
Purchase Details
Closed on
May 12, 2010
Sold by
Nash Development
Bought by
Zou Jizuo and Zhao Li
Current Estimated Value
Home Financials for this Owner
Home Financials are based on the most recent Mortgage that was taken out on this home.
Original Mortgage
$720,000
Outstanding Balance
$482,351
Interest Rate
5.04%
Mortgage Type
New Conventional
Estimated Equity
$1,929,387
Purchase Details
Closed on
Dec 7, 2009
Sold by
Kim Joo Dong and Kim Im Jik
Bought by
Nash Development Llc
Purchase Details
Closed on
Apr 28, 1998
Sold by
Blair Patricia M
Bought by
Kim Joo Dong and Kim Im Jik
Home Financials for this Owner
Home Financials are based on the most recent Mortgage that was taken out on this home.
Original Mortgage
$380,000
Interest Rate
7%
Purchase Details
Closed on
Feb 22, 1995
Sold by
Colucci Patricia M and Blair Patricia Marie
Bought by
Blair Patricia Marie
Create a Home Valuation Report for This Property
The Home Valuation Report is an in-depth analysis detailing your home's value as well as a comparison with similar homes in the area
Home Values in the Area
Average Home Value in this Area
Purchase History
| Date | Buyer | Sale Price | Title Company |
|---|---|---|---|
| Zou Jizuo | $938,000 | Fidelity National Title Co | |
| Nash Development Llc | $867,100 | None Available | |
| Kim Joo Dong | $475,000 | Old Republic Title Company | |
| Blair Patricia Marie | -- | -- |
Source: Public Records
Mortgage History
| Date | Status | Borrower | Loan Amount |
|---|---|---|---|
| Open | Zou Jizuo | $720,000 | |
| Previous Owner | Kim Joo Dong | $380,000 |
Source: Public Records
Tax History Compared to Growth
Tax History
| Year | Tax Paid | Tax Assessment Tax Assessment Total Assessment is a certain percentage of the fair market value that is determined by local assessors to be the total taxable value of land and additions on the property. | Land | Improvement |
|---|---|---|---|---|
| 2025 | $15,128 | $1,210,776 | $908,088 | $302,688 |
| 2024 | $15,128 | $1,187,036 | $890,283 | $296,753 |
| 2023 | $14,850 | $1,163,762 | $872,827 | $290,935 |
| 2022 | $14,722 | $1,140,944 | $855,713 | $285,231 |
| 2021 | $14,435 | $1,118,574 | $838,935 | $279,639 |
| 2020 | $14,122 | $1,107,105 | $830,333 | $276,772 |
| 2019 | $13,827 | $1,085,398 | $814,052 | $271,346 |
| 2018 | $13,696 | $1,064,117 | $798,091 | $266,026 |
| 2017 | $13,589 | $1,043,253 | $782,443 | $260,810 |
| 2016 | $13,383 | $1,022,798 | $767,101 | $255,697 |
| 2015 | $13,300 | $1,007,436 | $755,579 | $251,857 |
| 2014 | $12,825 | $987,703 | $740,779 | $246,924 |
Source: Public Records
Map
Nearby Homes
- 6805 Almaden Rd
- 6628 Wildwood Ct
- 6803 Lenwood Way
- 6698 Charter Oak Place
- 1122 Hearth Ct
- 6605 Bret Harte Dr
- 6579 Cooperage Ct
- 1171 Wilhelmina Way
- 6565 Stonehill Dr
- 1174 Old Oak Dr
- 6421 Montana Ct
- 6840 Hampton Dr
- 18950 Graystone Ln
- 6384 Farm Hill Way
- 6997 Elwood Rd
- 1238 Wooded Hills Dr
- 6898 Shearwater Dr
- 1101 Culligan Blvd
- 1140 Mallard Ridge Loop
- 7025 Bret Harte Dr
- 6824 Trinidad Dr
- 6816 Trinidad Dr
- 6688 Mount Holly Dr
- 6812 Trinidad Dr
- 6690 Mount Holly Dr
- 6682 Mount Holly Dr
- 6819 Trinidad Dr
- 6823 Trinidad Dr
- 6808 Trinidad Dr
- 6815 Trinidad Dr
- 6827 Trinidad Dr
- 6694 Mount Holly Dr
- 6811 Trinidad Dr
- 6829 Trinidad Dr
- 6804 Trinidad Dr
- 6832 Trinidad Dr
- 6670 Mount Holly Dr
- 6807 Trinidad Dr
- 6698 Mount Holly Dr
- 6689 Mount Holly Dr