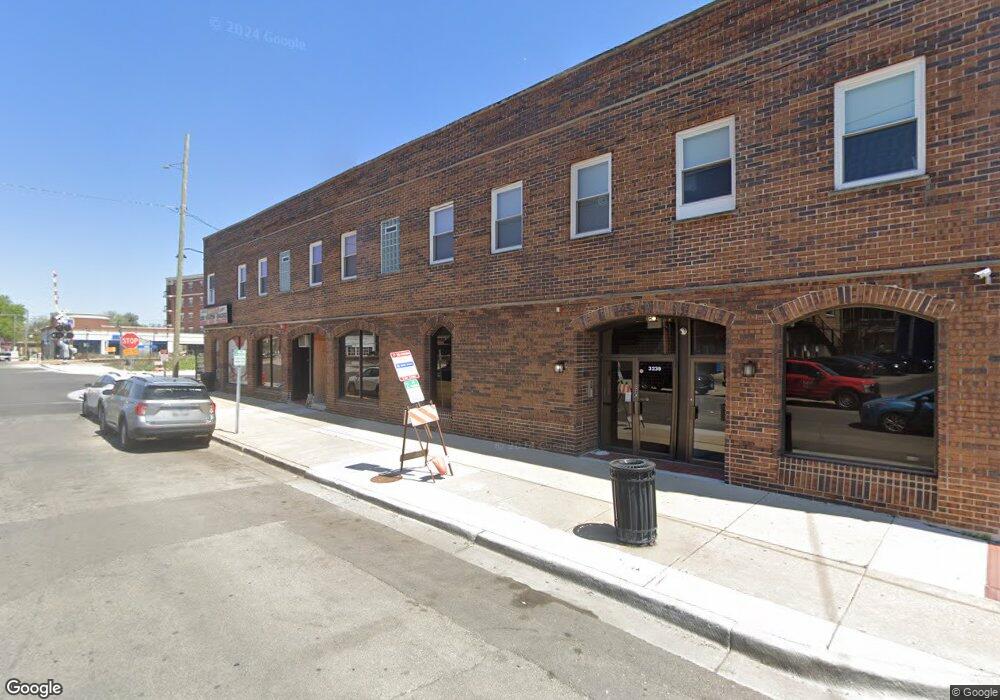
6820 W Windsor Ave Berwyn, IL 60402
Estimated Value: $1,282,755
--
Bed
--
Bath
--
Sq Ft
3,920
Sq Ft Lot
About This Home
This home is located at 6820 W Windsor Ave, Berwyn, IL 60402 and is currently estimated at $1,282,755. 6820 W Windsor Ave is a home located in Cook County with nearby schools including Irving Elementary School, Heritage Middle School, and J. Sterling Morton High School West.
Ownership History
Date
Name
Owned For
Owner Type
Purchase Details
Closed on
Dec 1, 2021
Sold by
Rayan Properties Inc
Bought by
Keystone Berwyn Llc
Current Estimated Value
Home Financials for this Owner
Home Financials are based on the most recent Mortgage that was taken out on this home.
Original Mortgage
$750,000
Interest Rate
3.11%
Mortgage Type
Commercial
Purchase Details
Closed on
Oct 13, 2017
Sold by
Oudeh Richard
Bought by
Rayan Properties Inc
Purchase Details
Closed on
Jan 15, 2009
Sold by
Chicago Title Land Trust Company
Bought by
Oudeh Richard
Purchase Details
Closed on
Dec 7, 2000
Sold by
Old Kent Bank
Bought by
Old Kent Bank and Trust #13120
Home Financials for this Owner
Home Financials are based on the most recent Mortgage that was taken out on this home.
Original Mortgage
$544,000
Interest Rate
9.25%
Mortgage Type
Commercial
Create a Home Valuation Report for This Property
The Home Valuation Report is an in-depth analysis detailing your home's value as well as a comparison with similar homes in the area
Home Values in the Area
Average Home Value in this Area
Purchase History
| Date | Buyer | Sale Price | Title Company |
|---|---|---|---|
| Keystone Berwyn Llc | $1,000,000 | Fidelity National Title Ins | |
| Rayan Properties Inc | $514,500 | Attorney | |
| Oudeh Richard | -- | Chicago Title Land Trust Co | |
| Old Kent Bank | $340,000 | Prairie Title |
Source: Public Records
Mortgage History
| Date | Status | Borrower | Loan Amount |
|---|---|---|---|
| Closed | Keystone Berwyn Llc | $750,000 | |
| Previous Owner | Old Kent Bank | $544,000 |
Source: Public Records
Tax History Compared to Growth
Tax History
| Year | Tax Paid | Tax Assessment Tax Assessment Total Assessment is a certain percentage of the fair market value that is determined by local assessors to be the total taxable value of land and additions on the property. | Land | Improvement |
|---|---|---|---|---|
| 2024 | $62,252 | $174,138 | $15,241 | $158,897 |
| 2023 | $63,693 | $174,138 | $15,241 | $158,897 |
| 2022 | $63,693 | $140,168 | $14,568 | $125,600 |
| 2021 | $61,790 | $140,168 | $14,568 | $125,600 |
| 2020 | $58,397 | $140,168 | $14,568 | $125,600 |
| 2019 | $54,846 | $121,691 | $10,309 | $111,382 |
| 2018 | $51,625 | $121,691 | $10,309 | $111,382 |
| 2017 | $52,836 | $121,691 | $10,309 | $111,382 |
| 2016 | $52,249 | $120,478 | $9,413 | $111,065 |
| 2015 | $47,691 | $112,182 | $9,413 | $102,769 |
| 2014 | $53,829 | $131,292 | $9,413 | $121,879 |
| 2013 | $40,583 | $111,317 | $9,413 | $101,904 |
Source: Public Records
Map
Nearby Homes
- 3303 Grove Ave Unit 600
- 3140 Grove Ave
- 3302 Kenilworth Ave
- 3330 Grove Ave Unit 1S
- 3124 Oak Park Ave
- 3142 Kenilworth Ave
- 3212 Clinton Ave
- 6810 31st St
- 3420 Grove Ave
- 3416 Euclid Ave
- 6924 34th St
- 3031 Oak Park Ave
- 3240 East Ave
- 3418 Wesley Ave
- 7005 34th St
- 3218 Scoville Ave
- 3002 Euclid Ave
- 3019 Wesley Ave
- 3145 Wisconsin Ave
- 3002 Wesley Ave
- 6820 W Windsor Ave Unit 100-101
- 6816 W Windsor Ave Unit 104
- 6818 W Windsor Ave
- 6812 W Windsor Ave
- 3245 Grove Ave
- 6814 Windsor Ave
- 6810 W Windsor Ave
- 3248 Grove Ave
- 3242 Oak Park Ave
- 3242 Oak Park Ave Unit 2
- 3242 Oak Park Ave Unit C
- 3242 Oak Park Ave Unit 4
- 3242 Oak Park Ave Unit 5
- 3242 Oak Park Ave Unit 3
- 3244 Oak Park Ave Unit 5
- 3244 Oak Park Ave Unit 10
- 3244 Oak Park Ave Unit 3
- 3244 Oak Park Ave Unit 6
- 3244 Oak Park Ave Unit 7
- 3244 Oak Park Ave Unit 1