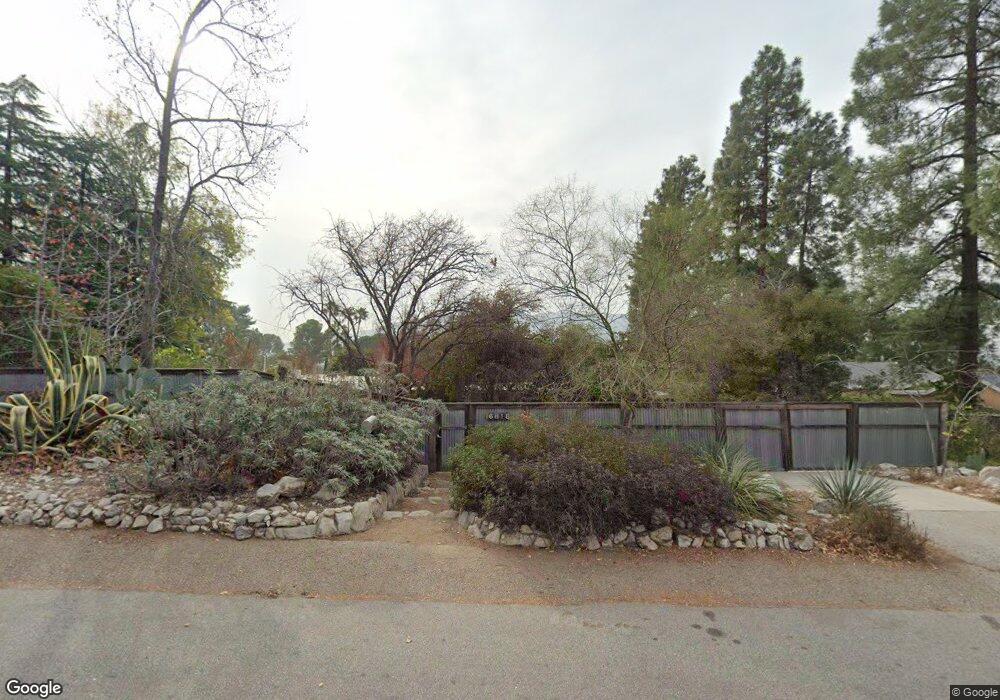
6822 Apperson St Tujunga, CA 91042
Estimated Value: $1,010,000 - $1,487,000
2
Beds
2
Baths
1,812
Sq Ft
$657/Sq Ft
Est. Value
About This Home
This home is located at 6822 Apperson St, Tujunga, CA 91042 and is currently estimated at $1,191,248, approximately $657 per square foot. 6822 Apperson St is a home located in Los Angeles County with nearby schools including Pinewood Avenue Elementary School, Mt. Gleason Middle School, and Verdugo Hills Senior High School.
Ownership History
Date
Name
Owned For
Owner Type
Purchase Details
Closed on
Feb 16, 2005
Sold by
Austin Aaron E
Bought by
Austin Aaron E and Austin Carol A
Current Estimated Value
Purchase Details
Closed on
Dec 20, 1999
Sold by
Austin Aaron E
Bought by
Austin Aaron E and Austin Carol A
Home Financials for this Owner
Home Financials are based on the most recent Mortgage that was taken out on this home.
Original Mortgage
$180,000
Outstanding Balance
$55,626
Interest Rate
7.69%
Estimated Equity
$1,135,622
Create a Home Valuation Report for This Property
The Home Valuation Report is an in-depth analysis detailing your home's value as well as a comparison with similar homes in the area
Home Values in the Area
Average Home Value in this Area
Purchase History
| Date | Buyer | Sale Price | Title Company |
|---|---|---|---|
| Austin Aaron E | -- | -- | |
| Austin Aaron E | -- | Southland Title |
Source: Public Records
Mortgage History
| Date | Status | Borrower | Loan Amount |
|---|---|---|---|
| Open | Austin Aaron E | $180,000 |
Source: Public Records
Tax History
| Year | Tax Paid | Tax Assessment Tax Assessment Total Assessment is a certain percentage of the fair market value that is determined by local assessors to be the total taxable value of land and additions on the property. | Land | Improvement |
|---|---|---|---|---|
| 2025 | $4,213 | $324,509 | $133,437 | $191,072 |
| 2024 | $4,213 | $318,147 | $130,821 | $187,326 |
| 2023 | $4,137 | $311,909 | $128,256 | $183,653 |
| 2022 | $3,956 | $305,794 | $125,742 | $180,052 |
| 2021 | $3,901 | $299,799 | $123,277 | $176,522 |
| 2019 | $3,791 | $290,908 | $119,621 | $171,287 |
| 2018 | $3,599 | $285,205 | $117,276 | $167,929 |
| 2016 | $3,424 | $274,132 | $112,723 | $161,409 |
| 2015 | $3,376 | $270,015 | $111,030 | $158,985 |
| 2014 | $3,401 | $264,727 | $108,856 | $155,871 |
Source: Public Records
Map
Nearby Homes
- 7025 Day St
- 6911 Valmont St
- 10459 Haines Canyon Ave
- 7049 Sunnycrest Trail
- 6557 Tokay Rd
- 10066 Golden Oaks Ave
- 7006 Valmont St Unit B
- 10214 Samoa Ave Unit 25
- 10015 Marcus Ave
- 7114 Wyngate St
- 10418 Samoa Ave
- 6834 Haywood St
- 0 Haines Canyon Ave
- 6436 Day St
- 10157 Durkee Ave
- 6834 Quinton Ln
- 6854 Quinton Ln
- 6812 Quinton Ln
- 7225 Apperson St Unit 105
- 0 Blanchard Canyon Unit SR25247538
- 6824 Apperson St
- 6812 Apperson St
- 6818 Apperson St
- 10234 Glory Ave
- 6830 Apperson St
- 6806 Apperson St
- 10244 Glory Ave
- 6825 Day St
- 6835 Day St
- 6728 Apperson St
- 10260 Glory Ave
- 6716 Apperson St
- 10220 Glory Ave
- 6803 Day St
- 6741 Day St
- 6727 Day St
- 10245 Glory Ave
- 10241 Glory Ave
- 10247 Glory Ave
- 6841 Parsons Trail
Your Personal Tour Guide
Ask me questions while you tour the home.