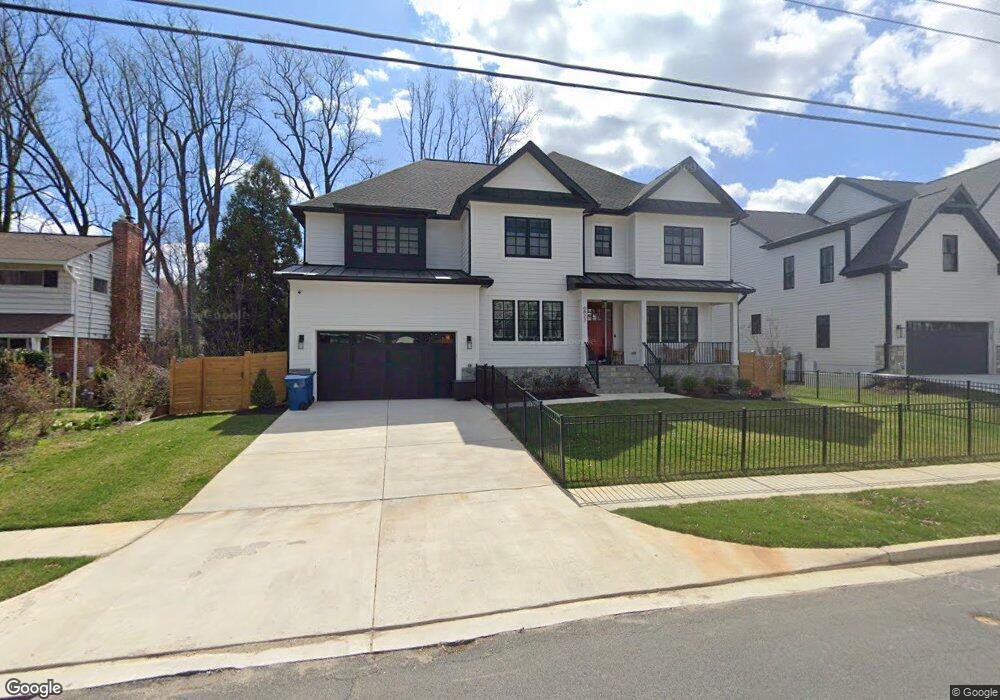
6823 Lemon Rd McLean, VA 22101
Estimated Value: $1,818,000 - $2,731,000
4
Beds
3
Baths
4,516
Sq Ft
$528/Sq Ft
Est. Value
About This Home
This home is located at 6823 Lemon Rd, McLean, VA 22101 and is currently estimated at $2,383,915, approximately $527 per square foot. 6823 Lemon Rd is a home located in Fairfax County with nearby schools including Kent Gardens Elementary School and Longfellow Middle School.
Ownership History
Date
Name
Owned For
Owner Type
Purchase Details
Closed on
Dec 16, 2011
Sold by
Perwich Alexander D
Bought by
Howery Michael S
Current Estimated Value
Home Financials for this Owner
Home Financials are based on the most recent Mortgage that was taken out on this home.
Original Mortgage
$535,200
Outstanding Balance
$366,113
Interest Rate
4.01%
Mortgage Type
New Conventional
Estimated Equity
$2,017,802
Create a Home Valuation Report for This Property
The Home Valuation Report is an in-depth analysis detailing your home's value as well as a comparison with similar homes in the area
Home Values in the Area
Average Home Value in this Area
Purchase History
| Date | Buyer | Sale Price | Title Company |
|---|---|---|---|
| Howery Michael S | $669,000 | -- |
Source: Public Records
Mortgage History
| Date | Status | Borrower | Loan Amount |
|---|---|---|---|
| Open | Howery Michael S | $535,200 |
Source: Public Records
Tax History Compared to Growth
Tax History
| Year | Tax Paid | Tax Assessment Tax Assessment Total Assessment is a certain percentage of the fair market value that is determined by local assessors to be the total taxable value of land and additions on the property. | Land | Improvement |
|---|---|---|---|---|
| 2025 | $16,678 | $2,593,860 | $556,000 | $2,037,860 |
| 2024 | $7,148 | $605,000 | $505,000 | $100,000 |
| 2023 | $11,794 | $1,024,270 | $505,000 | $519,270 |
| 2022 | $11,154 | $956,210 | $449,000 | $507,210 |
| 2021 | $10,347 | $864,740 | $420,000 | $444,740 |
| 2020 | $10,338 | $856,840 | $420,000 | $436,840 |
| 2019 | $9,961 | $825,630 | $420,000 | $405,630 |
| 2018 | $9,449 | $821,630 | $416,000 | $405,630 |
| 2017 | $9,690 | $818,400 | $412,000 | $406,400 |
| 2016 | $9,435 | $798,560 | $404,000 | $394,560 |
| 2015 | $8,717 | $765,320 | $396,000 | $369,320 |
| 2014 | $8,091 | $711,960 | $370,000 | $341,960 |
Source: Public Records
Map
Nearby Homes
- 6816 Dean Dr
- 6935 Southridge Dr
- 6975 Idylwood Rd
- 6613 Chesterfield Ave
- 1801 Great Falls St
- 6908 Southridge Dr
- 1715 Maxwell Ct
- 7000 Tyndale St
- 1707 Westmoreland St
- 1904 Lamson Place
- 6616 Kirby Ct
- 6603 Byrnes Dr
- 2005 Highboro Way
- 6820 Broyhill St
- 6607 Midhill Place
- 6609 Rockmont Ct
- 6610 Quinten St
- 1712 Dalewood Place
- 1710 Dalewood Place
- 1908 Pimmit Dr