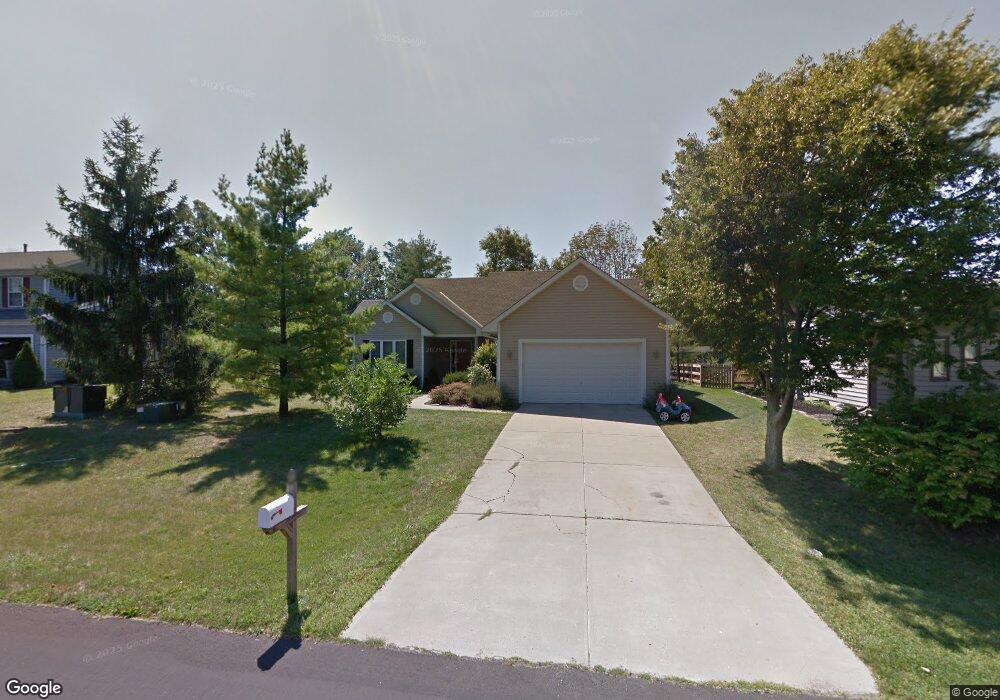
6825 Netherland Ct Liberty Township, OH 45044
Estimated Value: $344,000 - $392,000
3
Beds
2
Baths
1,825
Sq Ft
$204/Sq Ft
Est. Value
About This Home
This home is located at 6825 Netherland Ct, Liberty Township, OH 45044 and is currently estimated at $372,440, approximately $204 per square foot. 6825 Netherland Ct is a home located in Butler County with nearby schools including Woodland Elementary School, Liberty Junior School, and Lakota East High School.
Ownership History
Date
Name
Owned For
Owner Type
Purchase Details
Closed on
Sep 15, 2003
Sold by
Smolyansky Beverly H and Smolyansky Sergey
Bought by
Allen Bradley
Current Estimated Value
Purchase Details
Closed on
Feb 22, 2003
Sold by
Thompson Tommie L and Thompson Betty J
Bought by
Smolyansky Beverly H
Home Financials for this Owner
Home Financials are based on the most recent Mortgage that was taken out on this home.
Original Mortgage
$154,574
Interest Rate
5.94%
Mortgage Type
FHA
Purchase Details
Closed on
Oct 3, 1997
Sold by
Brough Charles R
Bought by
Thompson Tommie L and Thompson Betty
Home Financials for this Owner
Home Financials are based on the most recent Mortgage that was taken out on this home.
Original Mortgage
$119,250
Interest Rate
7.54%
Mortgage Type
New Conventional
Purchase Details
Closed on
Jan 1, 1987
Create a Home Valuation Report for This Property
The Home Valuation Report is an in-depth analysis detailing your home's value as well as a comparison with similar homes in the area
Home Values in the Area
Average Home Value in this Area
Purchase History
| Date | Buyer | Sale Price | Title Company |
|---|---|---|---|
| Allen Bradley | $33,000 | -- | |
| Smolyansky Beverly H | $157,000 | Title Resolutions | |
| Thompson Tommie L | $132,500 | -- | |
| -- | $13,000 | -- |
Source: Public Records
Mortgage History
| Date | Status | Borrower | Loan Amount |
|---|---|---|---|
| Previous Owner | Smolyansky Beverly H | $154,574 | |
| Previous Owner | Thompson Tommie L | $119,250 |
Source: Public Records
Tax History Compared to Growth
Tax History
| Year | Tax Paid | Tax Assessment Tax Assessment Total Assessment is a certain percentage of the fair market value that is determined by local assessors to be the total taxable value of land and additions on the property. | Land | Improvement |
|---|---|---|---|---|
| 2024 | $3,847 | $98,610 | $14,550 | $84,060 |
| 2023 | $3,799 | $99,250 | $14,550 | $84,700 |
| 2022 | $3,453 | $70,200 | $14,550 | $55,650 |
| 2021 | $3,435 | $70,200 | $14,550 | $55,650 |
| 2020 | $3,524 | $70,200 | $14,550 | $55,650 |
| 2019 | $5,792 | $60,130 | $13,520 | $46,610 |
| 2018 | $3,372 | $60,130 | $13,520 | $46,610 |
| 2017 | $3,437 | $60,130 | $13,520 | $46,610 |
| 2016 | $3,077 | $53,520 | $13,520 | $40,000 |
| 2015 | $3,076 | $53,520 | $13,520 | $40,000 |
| 2014 | $2,978 | $53,520 | $13,520 | $40,000 |
| 2013 | $2,978 | $50,020 | $10,000 | $40,020 |
Source: Public Records
Map
Nearby Homes
- 6785 Netherland Ct
- 6744 Netherland Ct
- 6921 Woodland View Dr
- 6895 Dutchland Blvd
- 6691 Netherland Dr
- 7228 Shady Hollow Ln
- 6951 Ash Creek Ct
- 7147 Wilhelmina Dr
- 7109 Maple Creek Dr
- 6548 Tulip Ln
- 2 Edam Ct
- 6821 Cincinnati Dayton Rd
- 6713 Harbour Town Dr
- 7232 Eaglestone Ct
- 7560 Shawnee Ln
- 6335 Dewberry Ct
- 6701 Maud Hughes Rd
- 7162 Wyandot Ln
- 7078 Lakota Ridge Dr
- 6703 Cincinnati Dayton Rd
- 6817 Netherland Ct
- 6833 Netherland Ct
- 6940 Netherland Dr
- 6841 Netherland Ct
- 7053 Dutchland Blvd
- 6801 Netherland Ct
- 6932 Netherland Dr
- 6939 Netherland Dr
- 7072 Dutchland Blvd
- 6793 Netherland Ct
- 7045 Dutchland Blvd
- 6926 Netherland Dr
- 7064 Dutchland Blvd
- 7056 Dutchland Blvd
- 7037 Dutchland Blvd
- 6918 Netherland Dr
- 6925 Netherland Dr
- 6786 Netherland Ct
- 7050 Dutchland Blvd
- 6771 Netherland Ct