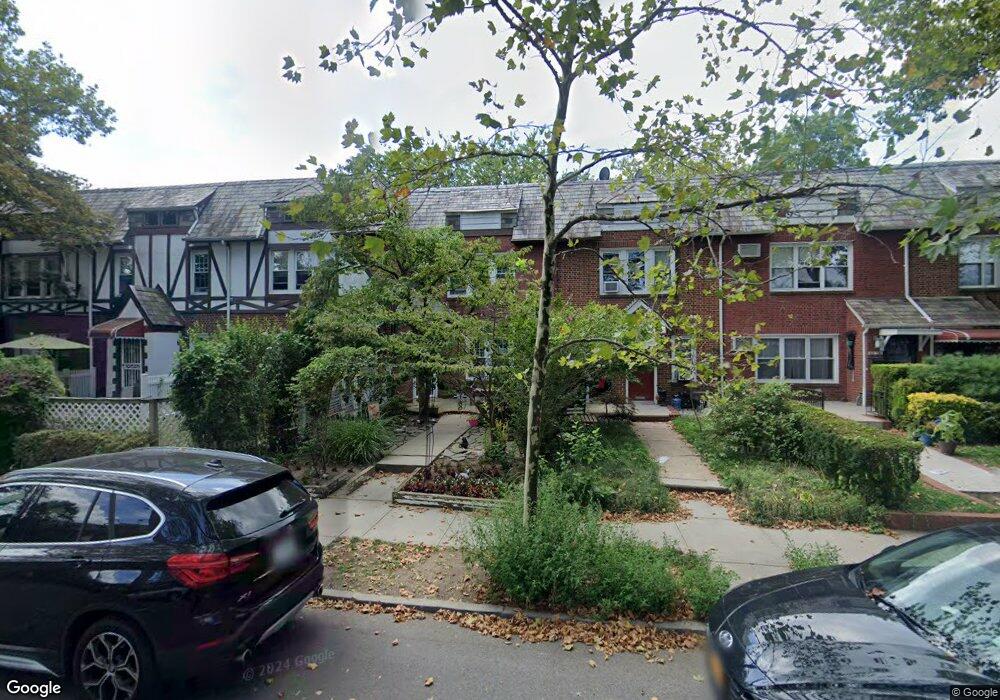
6826 Harrow St Forest Hills, NY 11375
Forest Hills NeighborhoodEstimated Value: $961,000 - $1,175,000
--
Bed
--
Bath
1,584
Sq Ft
$672/Sq Ft
Est. Value
About This Home
This home is located at 6826 Harrow St, Forest Hills, NY 11375 and is currently estimated at $1,065,025, approximately $672 per square foot. 6826 Harrow St is a home located in Queens County with nearby schools including Ps 144 Col Jeromus Remsen, J.H.S. 190 Russell Sage, and Queens Metropolitan High School.
Ownership History
Date
Name
Owned For
Owner Type
Purchase Details
Closed on
Oct 1, 2020
Sold by
Darnell Stephen R and Zhou Qin
Bought by
Chen Huan Huan
Current Estimated Value
Home Financials for this Owner
Home Financials are based on the most recent Mortgage that was taken out on this home.
Original Mortgage
$595,500
Outstanding Balance
$529,665
Interest Rate
2.9%
Mortgage Type
New Conventional
Estimated Equity
$535,360
Purchase Details
Closed on
Jul 2, 2004
Sold by
Chou Julia Li Yun
Bought by
Darnell Stephen R and Zhou Qin
Home Financials for this Owner
Home Financials are based on the most recent Mortgage that was taken out on this home.
Original Mortgage
$398,400
Interest Rate
6.25%
Mortgage Type
Purchase Money Mortgage
Purchase Details
Closed on
Jul 17, 1997
Sold by
Twirbutt Josef and Twirbutt Maria H
Bought by
Chou Julia Li Yun
Create a Home Valuation Report for This Property
The Home Valuation Report is an in-depth analysis detailing your home's value as well as a comparison with similar homes in the area
Home Values in the Area
Average Home Value in this Area
Purchase History
| Date | Buyer | Sale Price | Title Company |
|---|---|---|---|
| Chen Huan Huan | $794,000 | -- | |
| Chen Huan Huan | $794,000 | -- | |
| Darnell Stephen R | $498,000 | -- | |
| Darnell Stephen R | $498,000 | -- | |
| Chou Julia Li Yun | $220,000 | First American Title Ins Co | |
| Chou Julia Li Yun | $220,000 | First American Title Ins Co |
Source: Public Records
Mortgage History
| Date | Status | Borrower | Loan Amount |
|---|---|---|---|
| Open | Chen Huan Huan | $595,500 | |
| Closed | Chen Huan Huan | $595,500 | |
| Previous Owner | Darnell Stephen R | $398,400 |
Source: Public Records
Tax History Compared to Growth
Tax History
| Year | Tax Paid | Tax Assessment Tax Assessment Total Assessment is a certain percentage of the fair market value that is determined by local assessors to be the total taxable value of land and additions on the property. | Land | Improvement |
|---|---|---|---|---|
| 2025 | $9,413 | $47,975 | $8,790 | $39,185 |
| 2024 | $9,413 | $46,866 | $9,435 | $37,431 |
| 2023 | $8,894 | $44,284 | $8,840 | $35,444 |
| 2022 | $8,411 | $64,260 | $12,840 | $51,420 |
| 2021 | $8,415 | $66,240 | $12,840 | $53,400 |
| 2020 | $8,462 | $66,420 | $12,840 | $53,580 |
| 2019 | $8,170 | $65,760 | $12,840 | $52,920 |
| 2018 | $7,523 | $36,903 | $7,360 | $29,543 |
| 2017 | $7,158 | $35,112 | $7,909 | $27,203 |
| 2016 | $6,661 | $35,112 | $7,909 | $27,203 |
| 2015 | $3,995 | $33,316 | $9,986 | $23,330 |
| 2014 | $3,995 | $32,546 | $10,956 | $21,590 |
Source: Public Records
Map
Nearby Homes
- 6836 Groton St
- 94-11 69th Ave Unit 102
- 94-11 69th Ave Unit 307
- 68-37 Kessel St
- 67-31 Ingram St
- 6828 Kessel St
- 91-11 68th Ave
- 7285 Yellowstone Blvd
- 72-89 Yellowstone Blvd
- 67-54 Groton St
- 7267 Yellowstone Blvd
- 6915 Loubet St
- 66-92 Selfridge St Unit 3J
- 66-92 Selfridge St Unit 1E
- 66-92 Selfridge St Unit 3E
- 67-49 Groton St
- 90-01 68th Ave
- 69-55 Kessel St
- 67-60 Exeter St
- 68-40 Manse St
- 68-26 Harrow St Unit 2
- 68-26 Harrow St
- 6824 Harrow St
- 6828 Harrow St
- 6822 Harrow St
- 6830 Harrow St
- 6820 Harrow St
- 6832 Harrow St
- 6820 Harrow St
- 6818 Harrow St
- 6834 Harrow St
- 68-16 Harrow St
- 6836 Harrow St
- 6816 Harrow St
- 68-36 Harrow St
- 68-14 Harrow St
- 68-14 Harrow St Unit House
- 6825 Ingram St
- 6823 Ingram St
- 6827 Ingram St