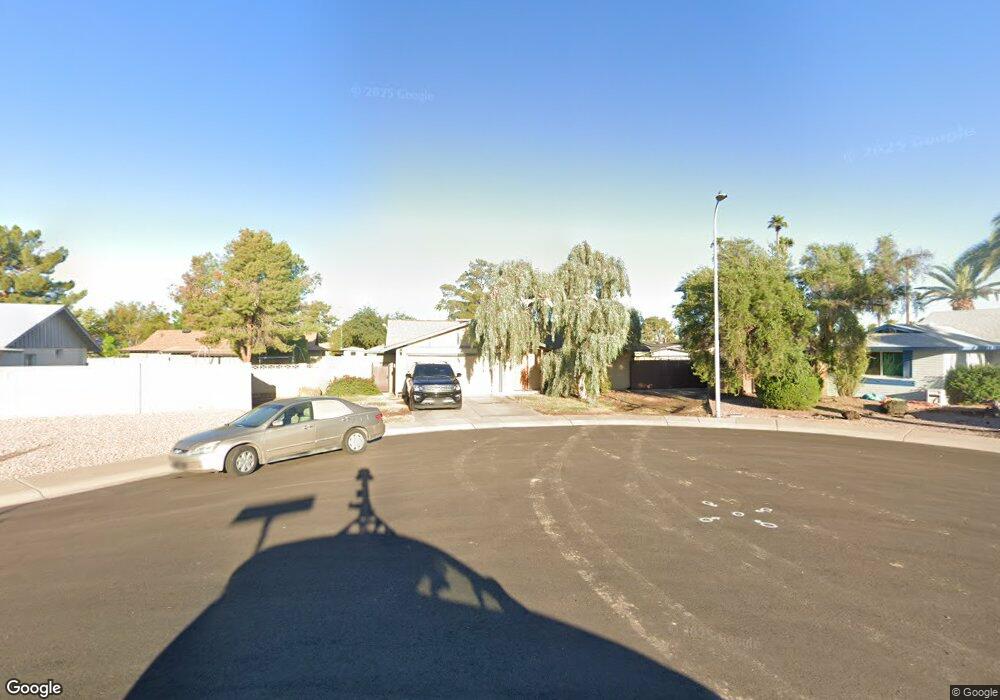
6826 S Newberry Rd Tempe, AZ 85283
South Tempe NeighborhoodEstimated Value: $404,823 - $518,000
Studio
2
Baths
1,444
Sq Ft
$328/Sq Ft
Est. Value
About This Home
This home is located at 6826 S Newberry Rd, Tempe, AZ 85283 and is currently estimated at $473,206, approximately $327 per square foot. 6826 S Newberry Rd is a home located in Maricopa County with nearby schools including Kyrene del Norte School, Kyrene de los Niños Elementary School, and Kyrene Middle School.
Ownership History
Date
Name
Owned For
Owner Type
Purchase Details
Closed on
Jul 17, 2015
Sold by
Brown Andrew and Brown Shanne
Bought by
Brown Andrew J and Brown Shanne A
Current Estimated Value
Home Financials for this Owner
Home Financials are based on the most recent Mortgage that was taken out on this home.
Original Mortgage
$187,100
Outstanding Balance
$146,499
Interest Rate
3.98%
Mortgage Type
New Conventional
Estimated Equity
$326,707
Purchase Details
Closed on
Sep 19, 2008
Sold by
Barron Michael and Chapman Barron Karen
Bought by
Brown Andrew and Brown Shanne
Home Financials for this Owner
Home Financials are based on the most recent Mortgage that was taken out on this home.
Original Mortgage
$201,335
Interest Rate
6.07%
Mortgage Type
FHA
Purchase Details
Closed on
Nov 25, 1996
Sold by
Renken Tad and Renken Deborah L
Bought by
Barron Michael and Chapman Barron Karen
Home Financials for this Owner
Home Financials are based on the most recent Mortgage that was taken out on this home.
Original Mortgage
$76,700
Interest Rate
5.55%
Mortgage Type
New Conventional
Create a Home Valuation Report for This Property
The Home Valuation Report is an in-depth analysis detailing your home's value as well as a comparison with similar homes in the area
Home Values in the Area
Average Home Value in this Area
Purchase History
| Date | Buyer | Sale Price | Title Company |
|---|---|---|---|
| Brown Andrew J | -- | Driggs Title Agency Inc | |
| Brown Andrew | $205,000 | Chicago Title | |
| Barron Michael | $95,895 | Fidelity Title |
Source: Public Records
Mortgage History
| Date | Status | Borrower | Loan Amount |
|---|---|---|---|
| Open | Brown Andrew J | $187,100 | |
| Previous Owner | Brown Andrew | $201,335 | |
| Previous Owner | Barron Michael | $76,700 |
Source: Public Records
Tax History
| Year | Tax Paid | Tax Assessment Tax Assessment Total Assessment is a certain percentage of the fair market value that is determined by local assessors to be the total taxable value of land and additions on the property. | Land | Improvement |
|---|---|---|---|---|
| 2025 | $1,771 | $18,951 | -- | -- |
| 2024 | $1,670 | $18,048 | -- | -- |
| 2023 | $1,670 | $33,070 | $6,610 | $26,460 |
| 2022 | $1,583 | $25,510 | $5,100 | $20,410 |
| 2021 | $1,645 | $24,310 | $4,860 | $19,450 |
| 2020 | $1,606 | $22,300 | $4,460 | $17,840 |
| 2019 | $1,555 | $20,160 | $4,030 | $16,130 |
| 2018 | $1,503 | $17,780 | $3,550 | $14,230 |
| 2017 | $1,441 | $16,820 | $3,360 | $13,460 |
| 2016 | $1,461 | $15,150 | $3,030 | $12,120 |
| 2015 | $1,349 | $14,520 | $2,900 | $11,620 |
Source: Public Records
Map
Nearby Homes
- 6743 S Newberry Rd
- 1032 E Redfield Rd
- 1011 E Redfield Rd
- 6736 S Stanley Place
- 1033 E Bendix Dr
- 987 E Divot Dr
- 6737 S Palm Dr
- 6801 S Palm Dr
- 1066 E Chilton Dr
- 738 E Strahan Dr
- 831 E Divot Dr
- 6815 S Juniper St
- 7100 S La Rosa Dr
- 6556 S La Rosa Dr
- 953 E Libra Dr
- 920 E Mcnair Dr
- 7467 S Rita Ln
- 941 E Libra Dr
- 1402 E Guadalupe Rd Unit 153
- 6512 S Mcallister Ave
- 1130 E Redfield Rd
- 1116 E Redfield Rd
- 6832 S Newberry Rd
- 1115 E Redfield Rd
- 1136 E Redfield Rd
- 1129 E Bell de Mar Dr
- 1123 E Bell de Mar Dr
- 1110 E Redfield Rd
- 1135 E Redfield Rd
- 1109 E Redfield Rd
- 1135 E Bell de Mar Dr
- 1117 E Bell de Mar Dr
- 1118 E Diamond Dr
- 1124 E Diamond Dr
- 1142 E Redfield Rd
- 1141 E Bell de Mar Dr
- 1141 E Redfield Rd
- 1110 E Diamond Dr
- 1104 E Redfield Rd
- 1103 E Redfield Rd
Your Personal Tour Guide
Ask me questions while you tour the home.