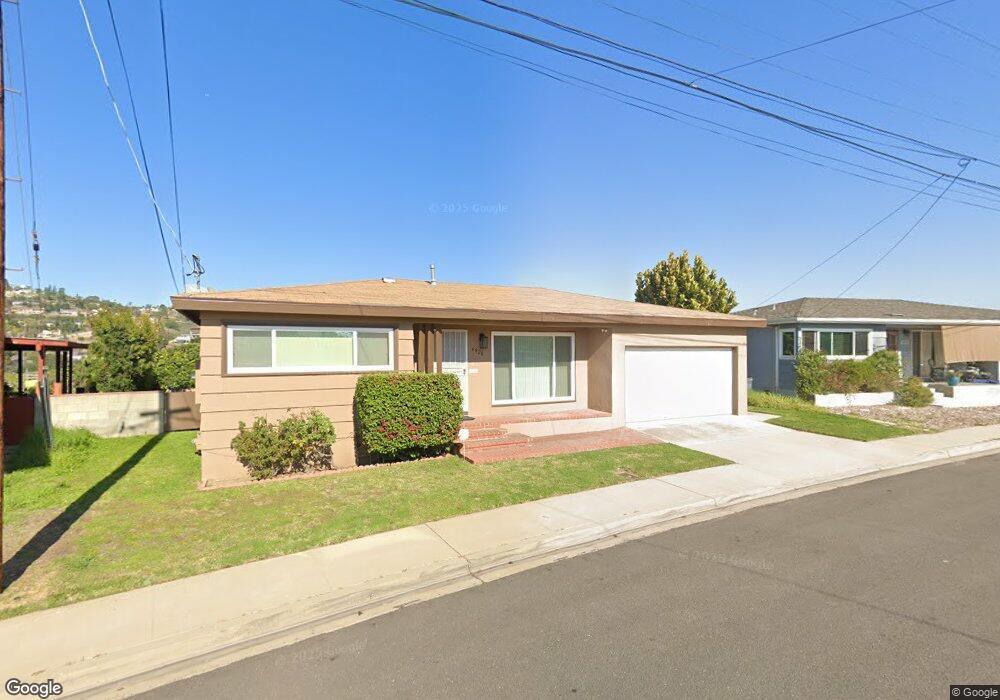
6828 Julie St San Diego, CA 92115
College East NeighborhoodEstimated Value: $861,000 - $999,195
3
Beds
2
Baths
1,647
Sq Ft
$551/Sq Ft
Est. Value
About This Home
This home is located at 6828 Julie St, San Diego, CA 92115 and is currently estimated at $906,799, approximately $550 per square foot. 6828 Julie St is a home located in San Diego County with nearby schools including Clay Elementary School, Mann Middle School, and Crawford High School.
Ownership History
Date
Name
Owned For
Owner Type
Purchase Details
Closed on
Sep 16, 2024
Sold by
Mario Armando Vidales Trust and Vadales Rene
Bought by
Nguyen Cuong Ngoc and Mai Vuong Thi
Current Estimated Value
Purchase Details
Closed on
Dec 15, 2021
Sold by
Vidales Mario Armando
Bought by
Vidales Mario Armando and Mario Armando Vidales Trust
Purchase Details
Closed on
Nov 7, 2000
Sold by
Stickney Michael J and Stickney Myra J
Bought by
Vidales Mario Armando
Home Financials for this Owner
Home Financials are based on the most recent Mortgage that was taken out on this home.
Original Mortgage
$205,350
Interest Rate
7.66%
Purchase Details
Closed on
Feb 27, 1996
Sold by
Dieffenbach Rosa
Bought by
Stickney Michael J and Stickney Myra J
Home Financials for this Owner
Home Financials are based on the most recent Mortgage that was taken out on this home.
Original Mortgage
$126,100
Interest Rate
6.98%
Purchase Details
Closed on
Jan 31, 1986
Create a Home Valuation Report for This Property
The Home Valuation Report is an in-depth analysis detailing your home's value as well as a comparison with similar homes in the area
Home Values in the Area
Average Home Value in this Area
Purchase History
| Date | Buyer | Sale Price | Title Company |
|---|---|---|---|
| Nguyen Cuong Ngoc | $845,000 | Chicago Title | |
| Vidales Mario Armando | -- | None Available | |
| Vidales Mario Armando | $215,000 | California Title Co | |
| Stickney Michael J | $130,000 | Commonwealth Land Title Co | |
| -- | $107,000 | -- |
Source: Public Records
Mortgage History
| Date | Status | Borrower | Loan Amount |
|---|---|---|---|
| Previous Owner | Vidales Mario Armando | $205,350 | |
| Previous Owner | Stickney Michael J | $126,100 |
Source: Public Records
Tax History Compared to Growth
Tax History
| Year | Tax Paid | Tax Assessment Tax Assessment Total Assessment is a certain percentage of the fair market value that is determined by local assessors to be the total taxable value of land and additions on the property. | Land | Improvement |
|---|---|---|---|---|
| 2025 | $4,547 | $845,000 | $433,428 | $411,572 |
| 2024 | $4,547 | $374,392 | $192,038 | $182,354 |
| 2023 | $4,445 | $367,052 | $188,273 | $178,779 |
| 2022 | $4,325 | $359,856 | $184,582 | $175,274 |
| 2021 | $4,294 | $352,801 | $180,963 | $171,838 |
| 2020 | $4,241 | $349,185 | $179,108 | $170,077 |
| 2019 | $4,164 | $342,340 | $175,597 | $166,743 |
| 2018 | $3,893 | $335,628 | $172,154 | $163,474 |
| 2017 | $80 | $329,048 | $168,779 | $160,269 |
| 2016 | $3,736 | $322,597 | $165,470 | $157,127 |
| 2015 | $3,680 | $317,752 | $162,985 | $154,767 |
| 2014 | $3,621 | $311,529 | $159,793 | $151,736 |
Source: Public Records
Map
Nearby Homes
- 6955 Alvarado Rd Unit 29
- 6955 Alvarado Rd Unit 30
- 6955 Alvarado Rd Unit 59
- 6911 Alvarado Rd Unit 20
- 6651 Reservoir Ln
- 7000 Saranac St Unit 17
- 7000 Saranac St Unit 54
- 7000 Saranac St Unit 2
- 6821-23 Mohawk St
- 5366 Lake Murray Blvd
- 6727 Cavite Ct
- 6615 Reservoir Ct
- 6496 Cleo St
- 7127 Saranac St
- 5157 Catoctin Dr
- 7195 Macquarie St
- 6457 Julie St
- 6926-28 Amherst St
- 6927 Amherst St Unit 8
- 6927 Amherst St Unit 3
- 6820 Julie St
- 6836 Julie St
- 6812 Julie St
- 6844 Julie St
- 6901 Alvarado Rd #3
- 6955 Alvarado Rd
- 6955 Alvar (Rental) Unit 73
- 6955 Alvarado Rd Unit 81
- 6955 Alvarado Rd Unit 71
- 6955 Alvarado Rd Unit 64
- 6955 Alvarado Rd Unit 60
- 6955 Alvarado Rd Unit 57
- 6955 Alvarado Rd Unit 53
- 6955 Alvarado Rd Unit 50
- 6955 Alvarado Rd Unit 49
- 6955 Alvarado Rd Unit 80
- 6955 Alvarado Rd Unit 76
- 6955 Alvarado Rd Unit 75
- 6955 Alvarado Rd Unit 73
- 6955 Alvarado Rd Unit 72