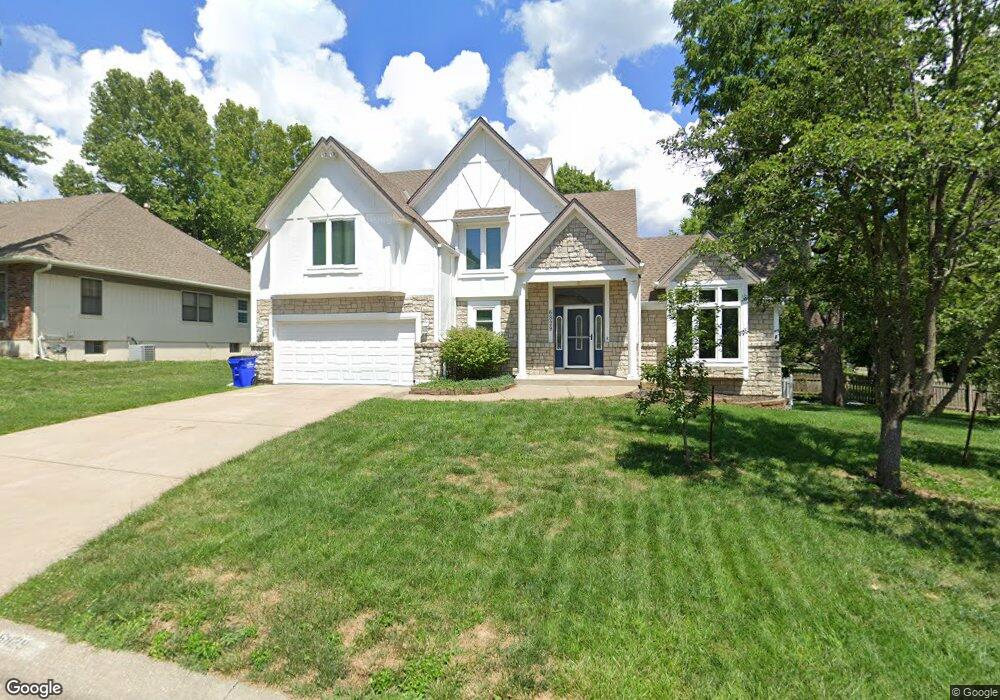
6829 Bluejacket St Shawnee, KS 66203
Estimated Value: $515,000 - $601,000
4
Beds
3
Baths
2,730
Sq Ft
$207/Sq Ft
Est. Value
About This Home
This home is located at 6829 Bluejacket St, Shawnee, KS 66203 and is currently estimated at $565,791, approximately $207 per square foot. 6829 Bluejacket St is a home located in Johnson County with nearby schools including Nieman Elementary School, Hocker Grove Middle School, and Shawnee Mission North High School.
Ownership History
Date
Name
Owned For
Owner Type
Purchase Details
Closed on
Jan 12, 2018
Sold by
Talia Milack and Talia Jodi F
Bought by
Talia Milack and Talia Jodi F
Current Estimated Value
Purchase Details
Closed on
Jun 30, 2009
Sold by
Ramsey Tom W and Ramsey Deborah J
Bought by
Talia Milack and Beerens Jodi F
Home Financials for this Owner
Home Financials are based on the most recent Mortgage that was taken out on this home.
Original Mortgage
$240,000
Interest Rate
4.84%
Mortgage Type
Purchase Money Mortgage
Purchase Details
Closed on
Apr 7, 2008
Sold by
Bondon Bill C and Bondon Deborah K
Bought by
Ramsey Tom W and Ramsey Deborah J
Home Financials for this Owner
Home Financials are based on the most recent Mortgage that was taken out on this home.
Original Mortgage
$240,000
Interest Rate
5.62%
Mortgage Type
Adjustable Rate Mortgage/ARM
Create a Home Valuation Report for This Property
The Home Valuation Report is an in-depth analysis detailing your home's value as well as a comparison with similar homes in the area
Home Values in the Area
Average Home Value in this Area
Purchase History
| Date | Buyer | Sale Price | Title Company |
|---|---|---|---|
| Talia Milack | -- | None Available | |
| Talia Milack | -- | First American Title Ins Co | |
| Ramsey Tom W | -- | First American Title Insuran |
Source: Public Records
Mortgage History
| Date | Status | Borrower | Loan Amount |
|---|---|---|---|
| Previous Owner | Talia Milack | $240,000 | |
| Previous Owner | Ramsey Tom W | $240,000 |
Source: Public Records
Tax History
| Year | Tax Paid | Tax Assessment Tax Assessment Total Assessment is a certain percentage of the fair market value that is determined by local assessors to be the total taxable value of land and additions on the property. | Land | Improvement |
|---|---|---|---|---|
| 2025 | $6,999 | $67,125 | $13,747 | $53,378 |
| 2024 | $6,999 | $65,538 | $13,747 | $51,791 |
| 2023 | $6,541 | $60,869 | $13,747 | $47,122 |
| 2022 | $5,750 | $53,349 | $11,944 | $41,405 |
| 2021 | $5,512 | $48,185 | $10,378 | $37,807 |
| 2020 | $5,332 | $46,000 | $9,437 | $36,563 |
| 2019 | $4,863 | $41,917 | $8,574 | $33,343 |
| 2018 | $4,633 | $39,778 | $7,791 | $31,987 |
| 2017 | $4,550 | $38,456 | $7,791 | $30,665 |
| 2016 | $4,333 | $36,156 | $7,791 | $28,365 |
| 2015 | $3,975 | $34,304 | $7,791 | $26,513 |
| 2013 | -- | $34,155 | $7,791 | $26,364 |
Source: Public Records
Map
Nearby Homes
- 10924 W 67th St
- 11315 W 68th St
- 10902 W 71st Place
- 6439 Melrose Ln
- 7219 Reeder St
- 11801 W 69th St
- 6404 Ballentine St
- 7206 Mastin St
- 7107 Garnett St
- 6617 Wedd St
- 9920 W 65th Place
- 6319 Robinhood Dr
- 7309 Stearns St
- 7311 Stearns St
- 7226 Mastin St
- 9985 Edelweiss Cir
- 7240 Mastin St
- 6606 Earnshaw St
- 10720 W 62nd St
- 6712 Charles St
- 6825 Bluejacket St
- 6833 Bluejacket St
- 6830 Bluejacket St
- 6826 Bluejacket St
- 6834 Bluejacket St
- 10700 W 69th St
- 6821 Bluejacket St
- 6822 Bluejacket St
- 6901 Bluejacket St
- 10650 W 69th St
- 6900 Ballentine St
- 6816 Bluejacket St
- 6900 Bluejacket St
- 6809 Bluejacket St
- 6905 Bluejacket St
- 6908 Ballentine St
- 6901 Ballentine St
- 6814 Bluejacket St
- 6828 Larsen Ln
- 6904 Bluejacket St
Your Personal Tour Guide
Ask me questions while you tour the home.